chapter 14 comprehensive problem 4 parts 2 & 3
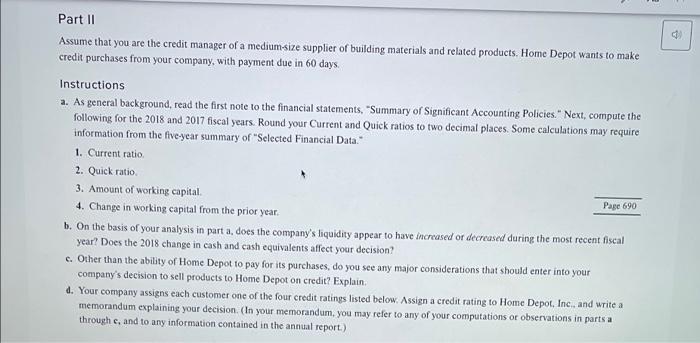
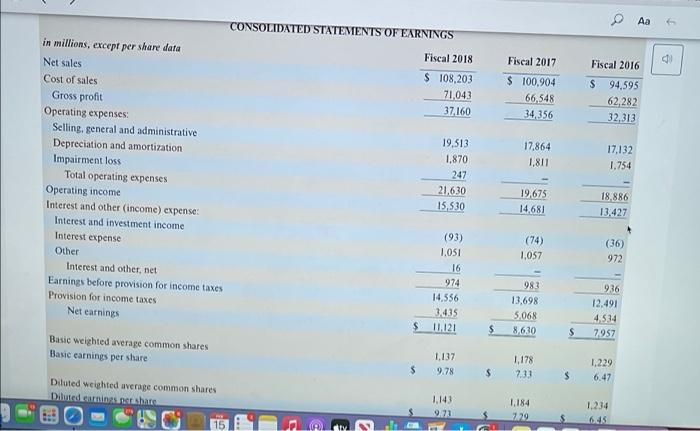
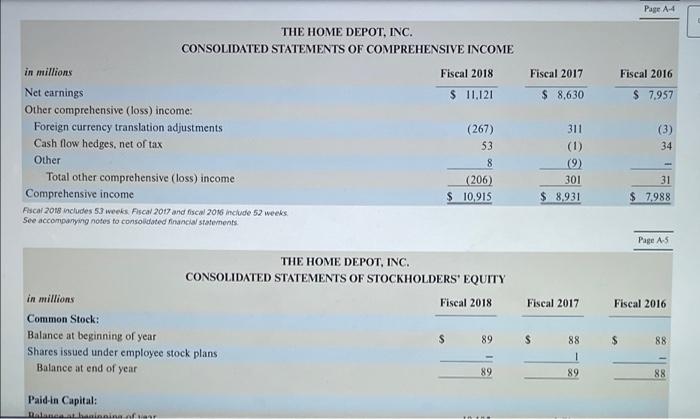
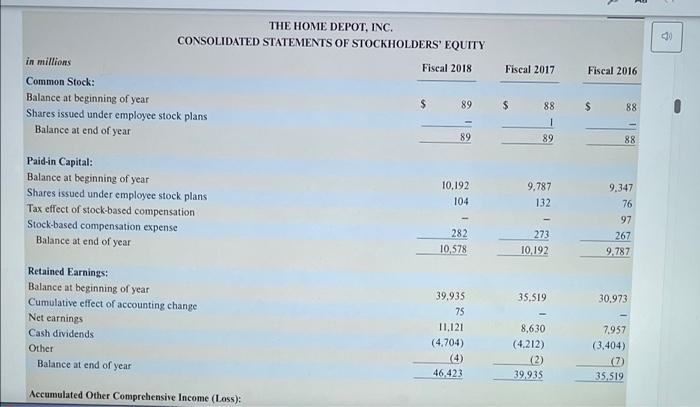
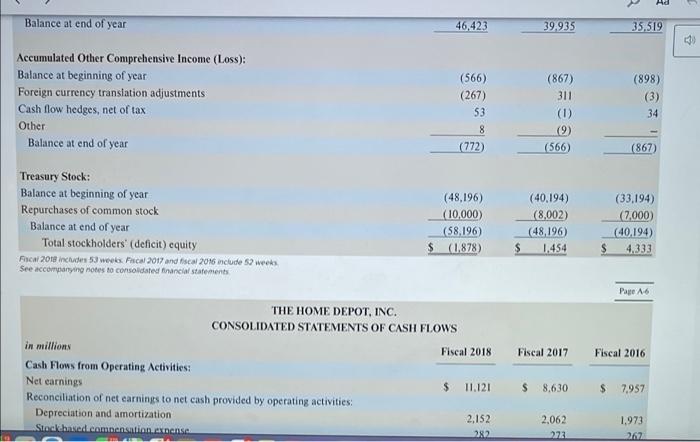
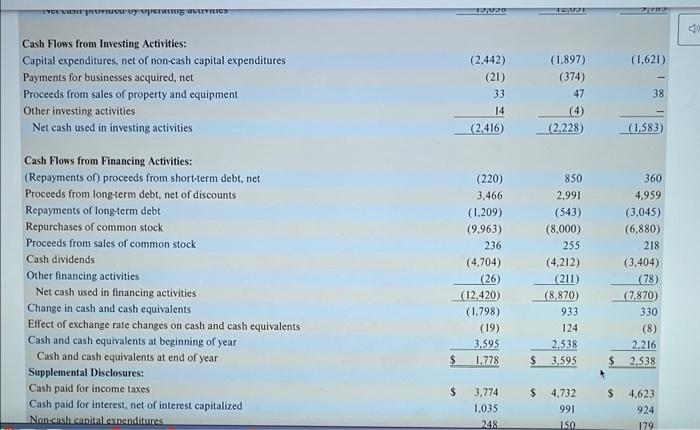
0 Part 11 Assume that you are the credit manager of a medium-size supplier of building materials and related products. Home Depot wants to make credit purchases from your company, with payment due in 60 days. Instructions a. As general background, read the first note to the financial statements, "Summary of Significant Accounting Policies." Next, compute the following for the 2018 and 2017 fiscal years. Round your Current and Quick ratios to two decimal places. Some calculations may require information from the five-year summary of "Selected Financial Data." 1. Current ratio 2. Quick ratio 3. Amount of working capital Page 690 4. Change in working capital from the prior year. b. On the basis of your analysis in part a, does the company's liquidity appear to have increased or decreased during the most recent fiscal year? Does the 2018 change in cash and cash equivalents affect your decision? c. Other than the ability of Home Depot to pay for its purchases, do you see any major considerations that should enter into your company's decision to sell products to Home Depot on credit? Explain. d. Your company assigns each customer one of the four credit ratings listed below. Assign a credit rating to Home Depot, Inc., and write a memorandum explaining your decision. (In your memorandum, you may refer to any of your computations or observations in parts a through e, and to any information contained in the annual report.) CONSOLIDATED STATEMENTS OF EARNINGS Fiscal 2018 Fiscal 2017 $ 108,203 71,043 37160 $ 100,904 66,548 34, 356 Fiscal 2016 $ 94,595 62,282 32,313 17,864 1.811 17,132 1.754 in millions, except per share data Net sales Cost of sales Gross profit Operating expenses Selling, general and administrative Depreciation and amortization Impairment loss Total operating expenses Operating income Interest and other (income) expense Interest and investment income Interest expense Other Interest and other, net Earnings before provision for income taxes Provision for income taxes Net carnings 19,513 1,870 247 21.630 15,530 19,675 14,681 18.886 13.427 (74) 1,057 (36) 972 (93) 1.051 16 974 14,556 3.435 11.121 983 13,698 5.068 8630 936 12.491 4.534 7957 $ $ Basic weighted average common shares Basic earnings per share 1.137 9.78 $ $ 1,178 7.31 1.229 6.47 $ Diluted weighted average common shares Dilutedcaminhar 1.143 9.72 1.184 729 1.234 6. 15 w Page 44 Fiscal 2017 Fiscal 2016 $ 8,630 $ 7.957 THE HOME DEPOT, INC. CONSOLIDATED STATEMENTS OF COMPREHENSIVE INCOME in millions Fiscal 2018 Net earnings $ 11,121 Other comprehensive (loss) income: Foreign currency translation adjustments (267) Cash flow hedges, net of tax 53 Other 8 Total other comprehensive (loss) income (206) Comprehensive income $ 10,915 Pascal 2018 includes 5.3 weeks Ascal 2017 and fiscal 2016 include 52 weeks See accompanying notes to consolidated financial statenents (3) 34 311 (1) (9) 301 $ 8,931 31 $ 7,988 Page AS Fiscal 2017 Fiscal 2016 THE HOME DEPOT, INC. CONSOLIDATED STATEMENTS OF STOCKHOLDERS' EQUITY in millions Fiscal 2018 Common Stock: Balance at beginning of year $ 89 Shares issued under employee stock plans Balance at end of year 89 $ $ 88 88 1 89 88 Paid-in Capital: Nathani nina THE HOME DEPOT, INC. CONSOLIDATED STATEMENTS OF STOCKHOLDERS' EQUITY 030 in millions Fiscal 2018 Fiscal 2017 Fiscal 2016 Common Stock: Balance at beginning of year Shares issued under employee stock plans Balance at end of year $ 89 $ $ 88 88 1 89 89 88 Paid-in Capital: Balance at beginning of year Shares issued under employee stock plans Tax effect of stock-based compensation Stock-based compensation expense Balance at end of year 10,192 104 9,787 132 9.347 76 97 267 9,787 282 10,578 273 10.192 35,519 30.973 Retained Earnings: Balance at beginning of year Cumulative effect of accounting change Net earnings Cash dividends Other Balance at end of year 39.935 75 11.121 (4.704) (4) 46,423 8,630 (4,212) (2) 39.935 7957 (3,404) 7) 35,519 Accumulated Other Comprehensive Income (Loss): Ad Balance at end of year 46,423 39.935 35,519 130 Accumulated Other Comprehensive Income (Loss): Balance at beginning of year Foreign currency translation adjustments Cash flow hedges, net of tax Other Balance at end of year (566) (267) 53 8 (772) (867) 311 (1) (9) (566) (898) (3) 34 (867) Treasury Stock: Balance at beginning of year Repurchases of common stock Balance at end of year Total stockholders' deficit) equity For 2018 includes 53 weeks Fiscal 2017 and fiscal 2016 include 52 weeks See accompanying notes to consolidated financial statements (40.194) (8,002) (48,196) (10,000) (58.196) $ (1.878) (33.194) (7.000 (40.194) 4,333 $ 1.454 Page A6 THE HOME DEPOT, INC. CONSOLIDATED STATEMENTS OF CASH FLOWS Fiscal 2018 Fiscal 2017 Fiscal 2016 in millions Cash Flows from Operating Activities: Net earnings Reconciliation of net earnings to net cash provided by operating activities: Depreciation and amortization Stoc chased.compensation annense $ 11.121 $ 8.630 $ 7,957 2,152 282 2.062 272 1,973 262 5 DOO TET 17 (1,621) Cash Flows from Investing Activities: Capital expenditures, net or non-cash capital expenditures Payments for businesses acquired, net Proceeds from sales of property and equipment Other investing activities Net cash used in investing activities (2.442) (21) 33 14 (2.416) (1,897) (374) 47 (4) (2,228) 38 (1.583) Cash Flows from Financing Activities: (Repayments of) proceeds from short-term debt, net Proceeds from long-term debt, net of discounts Repayments of long-term debt Repurchases of common stock Proceeds from sales of common stock Cash dividends Other financing activities Net cash used in financing activities Change in cash and cash equivalents Effect of exchange rate changes on cash and cash equivalents Cash and cash equivalents at beginning of year Cash and cash equivalents at end of year Supplemental Disclosures: Cash paid for income taxes Cash paid for interest, net of interest capitalized Nonsensheantal expenditures (220) 3.466 (1.209) (9.963) 236 (4,704) (26) (12.420) (1.798) (19) 3.595 $ 1.778 850 2,991 (543) (8,000) 255 (4,212) (211) (8,870) 933 124 2.538 $ 3.595 360 4,959 (3,045) (6.880) 218 (3,404) (78) (7,870) 330 (8) 2.216 2.538 $ $ $ $ 4,623 3,774 1,035 248 4,732 991 150 924 179 0 Part 11 Assume that you are the credit manager of a medium-size supplier of building materials and related products. Home Depot wants to make credit purchases from your company, with payment due in 60 days. Instructions a. As general background, read the first note to the financial statements, "Summary of Significant Accounting Policies." Next, compute the following for the 2018 and 2017 fiscal years. Round your Current and Quick ratios to two decimal places. Some calculations may require information from the five-year summary of "Selected Financial Data." 1. Current ratio 2. Quick ratio 3. Amount of working capital Page 690 4. Change in working capital from the prior year. b. On the basis of your analysis in part a, does the company's liquidity appear to have increased or decreased during the most recent fiscal year? Does the 2018 change in cash and cash equivalents affect your decision? c. Other than the ability of Home Depot to pay for its purchases, do you see any major considerations that should enter into your company's decision to sell products to Home Depot on credit? Explain. d. Your company assigns each customer one of the four credit ratings listed below. Assign a credit rating to Home Depot, Inc., and write a memorandum explaining your decision. (In your memorandum, you may refer to any of your computations or observations in parts a through e, and to any information contained in the annual report.) CONSOLIDATED STATEMENTS OF EARNINGS Fiscal 2018 Fiscal 2017 $ 108,203 71,043 37160 $ 100,904 66,548 34, 356 Fiscal 2016 $ 94,595 62,282 32,313 17,864 1.811 17,132 1.754 in millions, except per share data Net sales Cost of sales Gross profit Operating expenses Selling, general and administrative Depreciation and amortization Impairment loss Total operating expenses Operating income Interest and other (income) expense Interest and investment income Interest expense Other Interest and other, net Earnings before provision for income taxes Provision for income taxes Net carnings 19,513 1,870 247 21.630 15,530 19,675 14,681 18.886 13.427 (74) 1,057 (36) 972 (93) 1.051 16 974 14,556 3.435 11.121 983 13,698 5.068 8630 936 12.491 4.534 7957 $ $ Basic weighted average common shares Basic earnings per share 1.137 9.78 $ $ 1,178 7.31 1.229 6.47 $ Diluted weighted average common shares Dilutedcaminhar 1.143 9.72 1.184 729 1.234 6. 15 w Page 44 Fiscal 2017 Fiscal 2016 $ 8,630 $ 7.957 THE HOME DEPOT, INC. CONSOLIDATED STATEMENTS OF COMPREHENSIVE INCOME in millions Fiscal 2018 Net earnings $ 11,121 Other comprehensive (loss) income: Foreign currency translation adjustments (267) Cash flow hedges, net of tax 53 Other 8 Total other comprehensive (loss) income (206) Comprehensive income $ 10,915 Pascal 2018 includes 5.3 weeks Ascal 2017 and fiscal 2016 include 52 weeks See accompanying notes to consolidated financial statenents (3) 34 311 (1) (9) 301 $ 8,931 31 $ 7,988 Page AS Fiscal 2017 Fiscal 2016 THE HOME DEPOT, INC. CONSOLIDATED STATEMENTS OF STOCKHOLDERS' EQUITY in millions Fiscal 2018 Common Stock: Balance at beginning of year $ 89 Shares issued under employee stock plans Balance at end of year 89 $ $ 88 88 1 89 88 Paid-in Capital: Nathani nina THE HOME DEPOT, INC. CONSOLIDATED STATEMENTS OF STOCKHOLDERS' EQUITY 030 in millions Fiscal 2018 Fiscal 2017 Fiscal 2016 Common Stock: Balance at beginning of year Shares issued under employee stock plans Balance at end of year $ 89 $ $ 88 88 1 89 89 88 Paid-in Capital: Balance at beginning of year Shares issued under employee stock plans Tax effect of stock-based compensation Stock-based compensation expense Balance at end of year 10,192 104 9,787 132 9.347 76 97 267 9,787 282 10,578 273 10.192 35,519 30.973 Retained Earnings: Balance at beginning of year Cumulative effect of accounting change Net earnings Cash dividends Other Balance at end of year 39.935 75 11.121 (4.704) (4) 46,423 8,630 (4,212) (2) 39.935 7957 (3,404) 7) 35,519 Accumulated Other Comprehensive Income (Loss): Ad Balance at end of year 46,423 39.935 35,519 130 Accumulated Other Comprehensive Income (Loss): Balance at beginning of year Foreign currency translation adjustments Cash flow hedges, net of tax Other Balance at end of year (566) (267) 53 8 (772) (867) 311 (1) (9) (566) (898) (3) 34 (867) Treasury Stock: Balance at beginning of year Repurchases of common stock Balance at end of year Total stockholders' deficit) equity For 2018 includes 53 weeks Fiscal 2017 and fiscal 2016 include 52 weeks See accompanying notes to consolidated financial statements (40.194) (8,002) (48,196) (10,000) (58.196) $ (1.878) (33.194) (7.000 (40.194) 4,333 $ 1.454 Page A6 THE HOME DEPOT, INC. CONSOLIDATED STATEMENTS OF CASH FLOWS Fiscal 2018 Fiscal 2017 Fiscal 2016 in millions Cash Flows from Operating Activities: Net earnings Reconciliation of net earnings to net cash provided by operating activities: Depreciation and amortization Stoc chased.compensation annense $ 11.121 $ 8.630 $ 7,957 2,152 282 2.062 272 1,973 262 5 DOO TET 17 (1,621) Cash Flows from Investing Activities: Capital expenditures, net or non-cash capital expenditures Payments for businesses acquired, net Proceeds from sales of property and equipment Other investing activities Net cash used in investing activities (2.442) (21) 33 14 (2.416) (1,897) (374) 47 (4) (2,228) 38 (1.583) Cash Flows from Financing Activities: (Repayments of) proceeds from short-term debt, net Proceeds from long-term debt, net of discounts Repayments of long-term debt Repurchases of common stock Proceeds from sales of common stock Cash dividends Other financing activities Net cash used in financing activities Change in cash and cash equivalents Effect of exchange rate changes on cash and cash equivalents Cash and cash equivalents at beginning of year Cash and cash equivalents at end of year Supplemental Disclosures: Cash paid for income taxes Cash paid for interest, net of interest capitalized Nonsensheantal expenditures (220) 3.466 (1.209) (9.963) 236 (4,704) (26) (12.420) (1.798) (19) 3.595 $ 1.778 850 2,991 (543) (8,000) 255 (4,212) (211) (8,870) 933 124 2.538 $ 3.595 360 4,959 (3,045) (6.880) 218 (3,404) (78) (7,870) 330 (8) 2.216 2.538 $ $ $ $ 4,623 3,774 1,035 248 4,732 991 150 924 179