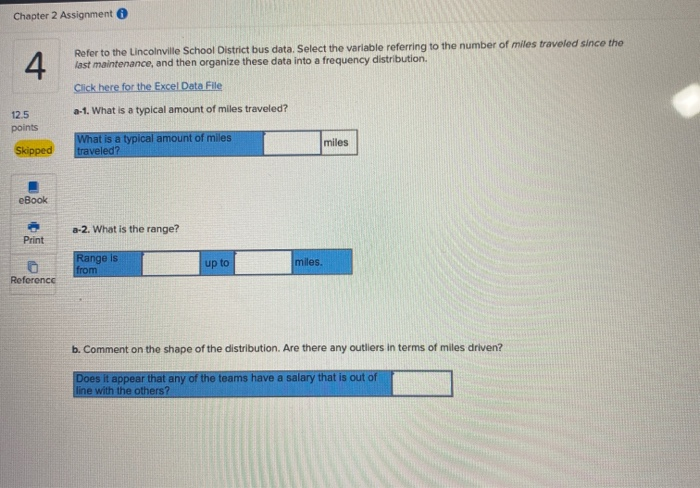
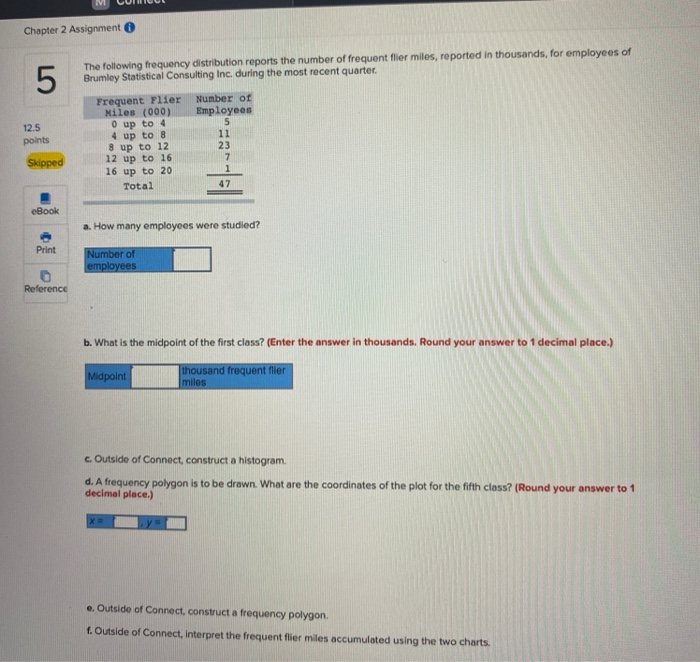
Chapter 2 Assignment 4 Refer to the Lincolnville School District bus data. Select the variable referring to the number of miles traveled since the last maintenance, and then organize these data into a frequency distribution. Click here for the Excel Data File 2-1. What is a typical amount of miles traveled? 12.5 points What is a typical amount of miles traveled? miles Skipped eBook a-2. What is the range? Print Range is from up to miles. 0 Reference b. Comment on the shape of the distribution. Are there any outliers in terms of miles driven? Does it appear that any of the teams have a salary that is out of line with the others? Chapter 2 Assignment 5 The following frequency distribution reports the number of frequent flier miles, reported in thousands, for employees of Brumley Statistical Consulting Inc, during the most recent quarter. 12.5 points Frequent Plier Niles (000) O up to 4 4 up to 8 8 up to 12 12 up to 16 16 up to 20 Total Number of Employees S 11 23 7 1 47 Skipped eBook a. How many employees were studied? Print Number of employees Reference b. What is the midpoint of the first class? (Enter the answer in thousands. Round your answer to 1 decimal place.) Midpoint thousand frequent flier miles c. Outside of Connect, construct a histogram. d. A frequency polygon is to be drawn. What are the coordinates of the plot for the fifth class? (Round your answer to 1 decimal place.) e Outside of Connect, construct a frequency polygon. f. Outside of Connect, interpret the frequent flier miles accumulated using the two charts. Chapter 2 Assignment 4 Refer to the Lincolnville School District bus data. Select the variable referring to the number of miles traveled since the last maintenance, and then organize these data into a frequency distribution. Click here for the Excel Data File 2-1. What is a typical amount of miles traveled? 12.5 points What is a typical amount of miles traveled? miles Skipped eBook a-2. What is the range? Print Range is from up to miles. 0 Reference b. Comment on the shape of the distribution. Are there any outliers in terms of miles driven? Does it appear that any of the teams have a salary that is out of line with the others? Chapter 2 Assignment 5 The following frequency distribution reports the number of frequent flier miles, reported in thousands, for employees of Brumley Statistical Consulting Inc, during the most recent quarter. 12.5 points Frequent Plier Niles (000) O up to 4 4 up to 8 8 up to 12 12 up to 16 16 up to 20 Total Number of Employees S 11 23 7 1 47 Skipped eBook a. How many employees were studied? Print Number of employees Reference b. What is the midpoint of the first class? (Enter the answer in thousands. Round your answer to 1 decimal place.) Midpoint thousand frequent flier miles c. Outside of Connect, construct a histogram. d. A frequency polygon is to be drawn. What are the coordinates of the plot for the fifth class? (Round your answer to 1 decimal place.) e Outside of Connect, construct a frequency polygon. f. Outside of Connect, interpret the frequent flier miles accumulated using the two charts