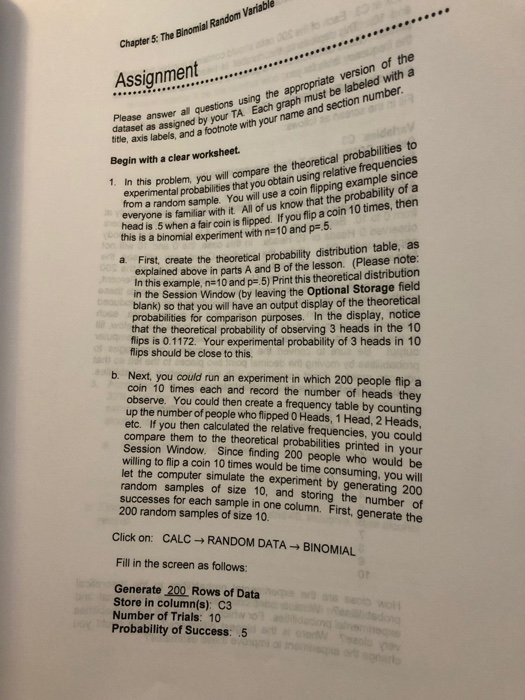
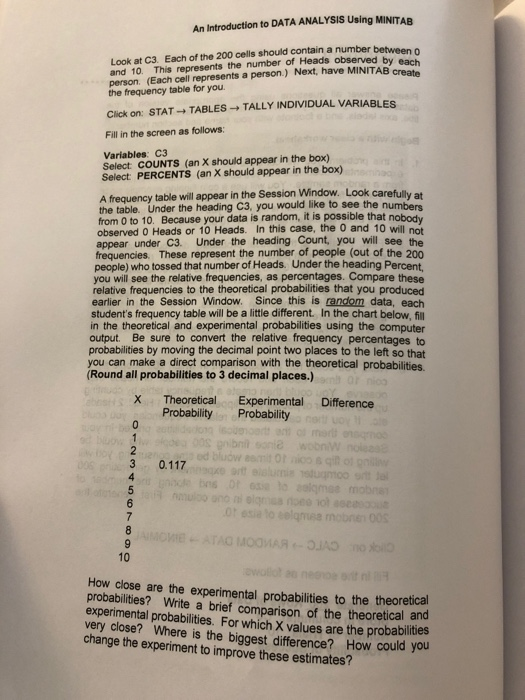
Chapter 5: The Binomial Randoni Variable Please answer all questions using the appropriate version of the Assignment dataset as assigned by your TA. Each graph must be labeled with a dataset as assigned a a abels, and aotnote with your name and section number. 1. In this problem, you will compare the theoretical probabilities to Begin with a clear worksheet. experimental probabilities that you obtain using relative frequencies from a random sample. You will use a coin flipping example since everyone is familiar with it. All of us know that the probability of a head is .5 when a fair coin is flipped. If you flip a coin 10 times, then this is a binomial experiment with n=10 and p=.5. a. First, create the theoretical probability distribution table, as explained above in parts A and B of the lesson. (Please note: In this example, n=10 and p=.5 ) Print this theoretical distribution in the Session Window (by leaving the Optional Storage field blank) so that you will have an output display of the theoretical probabilities for comparison purposes. In the display, notice that the theoretical probability of observing 3 heads in the 10 fips is 0.1172 . Your experimental probability of 3 heads in 10 flips should be close to this. b. Next, you could run an experiment in which 200 people flip a coin 10 times each and record the number of heads they observe. You could then create a frequency table by counting up the number of people who flipped 0 Heads, 1 Head, 2 Heads, etc. If you then calculated the relative frequencies, you could compare them to the theoretical probabilities printed in your Session Window. Since finding 200 people who would be willing to flip a coin 10 times would be time consuming, you will let the computer simulate the experiment by generating 200 random samples of size 10 , and storing the number of successes for each sample in one column. First, generate the 200 random samples of size 10. Click on: CALC RANDOM DATA BINOMIAL Fill in the screen as follows: Generate 200 Rows of Data Store in column(s): C3 Number of Trials: 10 Probability of Success: 5 An Introduction to DATA ANALYSIS Using MINITAB Look at C3. Each of the 200 cells should contain a number between 0 and 10 . This represents the number of Heads observed by each person. (Each cell represents a person.) Next, have MINITAB create the frequency table for you. Click on: STAT TABLES TALLY INDIVIDUAL VARIABLES Fill in the screen as follows: Variables: C3 Select COUNTS (an X should appear in the box) Select: PERCENTS (an X should appear in the box) A frequency table will appear in the Session Window. Look carefully at the table. Under the heading C3, you would like to see the numbers from 0 to 10. Because your data is random, it is possible that nobody observed 0 Heads or 10 Heads. In this case, the 0 and 10 will not appear under C3. Under the heading Count, you will see the frequencies. These represent the number of people (out of the 200 people) who tossed that number of Heads. Under the heading Percent, you will see the relative frequencies, as percentages. Compare these relative frequencies to the theoretical probabilities that you produced earlier in the Session Window. Since this is random data, each student's frequency table will be a little different. In the chart below, fill in the theoretical and experimental probabilities using the computer output. Be sure to convert the relative frequency percentages to probabilities by moving the decimal point two places to the left so that you can make a direct comparison with the theoretical probabilities. (Round all probabilities to 3 decimal places.) How close are the experimental probabilities to the theoretical probabilities? Write a brief comparison of the theoretical and experimental probabilities. For which X values are the probabilities very close? Where is the biggest difference? How could you change the experiment to improve these estimates? Chapter 5: The Binomial Randoni Variable Please answer all questions using the appropriate version of the Assignment dataset as assigned by your TA. Each graph must be labeled with a dataset as assigned a a abels, and aotnote with your name and section number. 1. In this problem, you will compare the theoretical probabilities to Begin with a clear worksheet. experimental probabilities that you obtain using relative frequencies from a random sample. You will use a coin flipping example since everyone is familiar with it. All of us know that the probability of a head is .5 when a fair coin is flipped. If you flip a coin 10 times, then this is a binomial experiment with n=10 and p=.5. a. First, create the theoretical probability distribution table, as explained above in parts A and B of the lesson. (Please note: In this example, n=10 and p=.5 ) Print this theoretical distribution in the Session Window (by leaving the Optional Storage field blank) so that you will have an output display of the theoretical probabilities for comparison purposes. In the display, notice that the theoretical probability of observing 3 heads in the 10 fips is 0.1172 . Your experimental probability of 3 heads in 10 flips should be close to this. b. Next, you could run an experiment in which 200 people flip a coin 10 times each and record the number of heads they observe. You could then create a frequency table by counting up the number of people who flipped 0 Heads, 1 Head, 2 Heads, etc. If you then calculated the relative frequencies, you could compare them to the theoretical probabilities printed in your Session Window. Since finding 200 people who would be willing to flip a coin 10 times would be time consuming, you will let the computer simulate the experiment by generating 200 random samples of size 10 , and storing the number of successes for each sample in one column. First, generate the 200 random samples of size 10. Click on: CALC RANDOM DATA BINOMIAL Fill in the screen as follows: Generate 200 Rows of Data Store in column(s): C3 Number of Trials: 10 Probability of Success: 5 An Introduction to DATA ANALYSIS Using MINITAB Look at C3. Each of the 200 cells should contain a number between 0 and 10 . This represents the number of Heads observed by each person. (Each cell represents a person.) Next, have MINITAB create the frequency table for you. Click on: STAT TABLES TALLY INDIVIDUAL VARIABLES Fill in the screen as follows: Variables: C3 Select COUNTS (an X should appear in the box) Select: PERCENTS (an X should appear in the box) A frequency table will appear in the Session Window. Look carefully at the table. Under the heading C3, you would like to see the numbers from 0 to 10. Because your data is random, it is possible that nobody observed 0 Heads or 10 Heads. In this case, the 0 and 10 will not appear under C3. Under the heading Count, you will see the frequencies. These represent the number of people (out of the 200 people) who tossed that number of Heads. Under the heading Percent, you will see the relative frequencies, as percentages. Compare these relative frequencies to the theoretical probabilities that you produced earlier in the Session Window. Since this is random data, each student's frequency table will be a little different. In the chart below, fill in the theoretical and experimental probabilities using the computer output. Be sure to convert the relative frequency percentages to probabilities by moving the decimal point two places to the left so that you can make a direct comparison with the theoretical probabilities. (Round all probabilities to 3 decimal places.) How close are the experimental probabilities to the theoretical probabilities? Write a brief comparison of the theoretical and experimental probabilities. For which X values are the probabilities very close? Where is the biggest difference? How could you change the experiment to improve these estimates