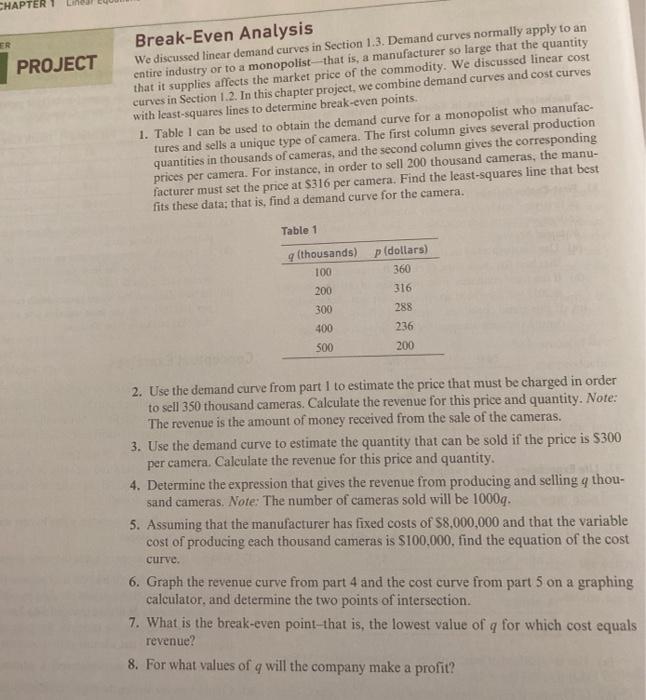
CHAPTER ER PROJECT Break-Even Analysis We discussed linear demand curves in Section 1.3. Demand curves normally apply to an entire industry or to a monopolist-that is, a manufacturer so large that the quantity that it supplies affects the market price of the commodity. We discussed linear cost curves in Section 1.2. In this chapter project, we combine demand curves and cost curves with least-squares lines to determine break-even points. 1. Table I can be used to obtain the demand curve for a monopolist who manufac- tures and sells a unique type of camera. The first column gives several production quantities in thousands of cameras, and the second column gives the corresponding prices per camera. For instance, in order to sell 200 thousand cameras, the manu- facturer must set the price at $316 per camera. Find the least squares line that best fits these data; that is, find a demand curve for the camera. Table 1 q (thousands) p(dollars) 100 360 200 316 300 288 400 236 500 200 2. Use the demand curve from part I to estimate the price that must be charged in order to sell 350 thousand cameras. Calculate the revenue for this price and quantity. Note: The revenue is the amount of money received from the sale of the cameras. 3. Use the demand curve to estimate the quantity that can be sold if the price is $300 per camera. Calculate the revenue for this price and quantity. 4. Determine the expression that gives the revenue from producing and selling q thou- sand cameras. Note: The number of cameras sold will be 1000g. 5. Assuming that the manufacturer has fixed costs of $8,000,000 and that the variable cost of producing each thousand cameras is $100,000, find the equation of the cost curve. 6. Graph the revenue curve from part 4 and the cost curve from part 5 on a graphing calculator and determine the two points of intersection. 7. What is the break-even point that is, the lowest value of q for which cost equals revenue? 8. For what values of q will the company make a profit? CHAPTER ER PROJECT Break-Even Analysis We discussed linear demand curves in Section 1.3. Demand curves normally apply to an entire industry or to a monopolist-that is, a manufacturer so large that the quantity that it supplies affects the market price of the commodity. We discussed linear cost curves in Section 1.2. In this chapter project, we combine demand curves and cost curves with least-squares lines to determine break-even points. 1. Table I can be used to obtain the demand curve for a monopolist who manufac- tures and sells a unique type of camera. The first column gives several production quantities in thousands of cameras, and the second column gives the corresponding prices per camera. For instance, in order to sell 200 thousand cameras, the manu- facturer must set the price at $316 per camera. Find the least squares line that best fits these data; that is, find a demand curve for the camera. Table 1 q (thousands) p(dollars) 100 360 200 316 300 288 400 236 500 200 2. Use the demand curve from part I to estimate the price that must be charged in order to sell 350 thousand cameras. Calculate the revenue for this price and quantity. Note: The revenue is the amount of money received from the sale of the cameras. 3. Use the demand curve to estimate the quantity that can be sold if the price is $300 per camera. Calculate the revenue for this price and quantity. 4. Determine the expression that gives the revenue from producing and selling q thou- sand cameras. Note: The number of cameras sold will be 1000g. 5. Assuming that the manufacturer has fixed costs of $8,000,000 and that the variable cost of producing each thousand cameras is $100,000, find the equation of the cost curve. 6. Graph the revenue curve from part 4 and the cost curve from part 5 on a graphing calculator and determine the two points of intersection. 7. What is the break-even point that is, the lowest value of q for which cost equals revenue? 8. For what values of q will the company make a profit