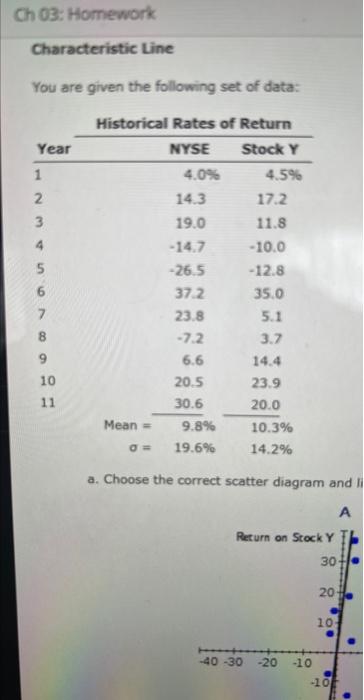
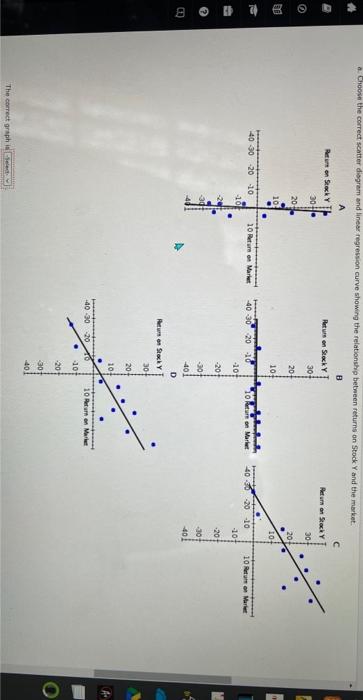
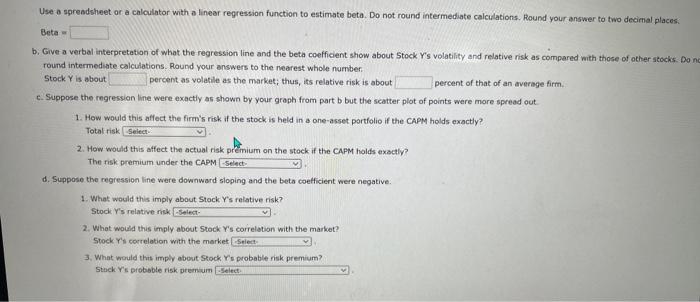
Characteristic Line You are given the following set of data: a. Choose the correct scatter diagram and in Use a sgreadsheet or a calculator with a linear regression function to estimate beta. Do not round intermediate calculations. Round your answer to two decimal places: Beta = b. Give a verbal interpretation of what the regression line and the beta coefficient show about Stock Y's volatility and relative risk as compared nith those of other stocks. Do n round intermediate calculations. Round your answers to the nearest whole number: Stock Y is about percent as volatile as the market; thus, its relative risk is about percent of that of an average firm. c. Suppose the regression line were exactly as shown by your groph from part b but the scatter plot of points were more spread out. 1. How would this affect the firm's risk if the stock is held in a one-asset partfolio if the CAPM holds exactly? Total risk 2. How would this affect the actual risk premium on the stock if the CAPM holds exactly? The risk premium under the CADM d. Suppose the regression line were downward sloping and the beta coefficient were negative. 1. What would this imply about Stock Y's relative risk? Stock Y's relative risk 2. What would this imply about stock Y's correlation with the market? Stock Y 's correlation with the market 3. What would this imply about Stock Ys ptobable nisk premium? Stack Y's probible risk premium Characteristic Line You are given the following set of data: a. Choose the correct scatter diagram and in Use a sgreadsheet or a calculator with a linear regression function to estimate beta. Do not round intermediate calculations. Round your answer to two decimal places: Beta = b. Give a verbal interpretation of what the regression line and the beta coefficient show about Stock Y's volatility and relative risk as compared nith those of other stocks. Do n round intermediate calculations. Round your answers to the nearest whole number: Stock Y is about percent as volatile as the market; thus, its relative risk is about percent of that of an average firm. c. Suppose the regression line were exactly as shown by your groph from part b but the scatter plot of points were more spread out. 1. How would this affect the firm's risk if the stock is held in a one-asset partfolio if the CAPM holds exactly? Total risk 2. How would this affect the actual risk premium on the stock if the CAPM holds exactly? The risk premium under the CADM d. Suppose the regression line were downward sloping and the beta coefficient were negative. 1. What would this imply about Stock Y's relative risk? Stock Y's relative risk 2. What would this imply about stock Y's correlation with the market? Stock Y 's correlation with the market 3. What would this imply about Stock Ys ptobable nisk premium? Stack Y's probible risk premium


