

Answered step by step
Verified Expert Solution
Question
1 Approved Answer
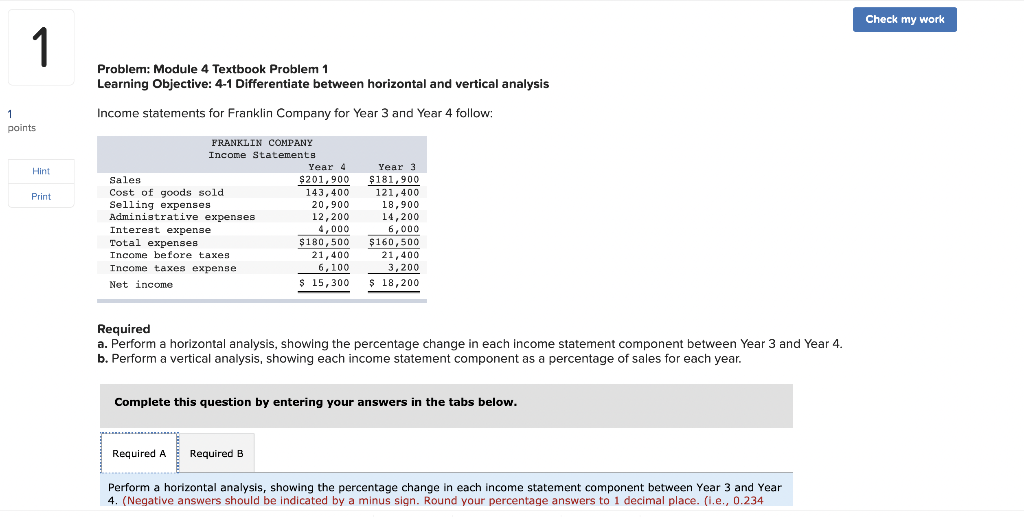
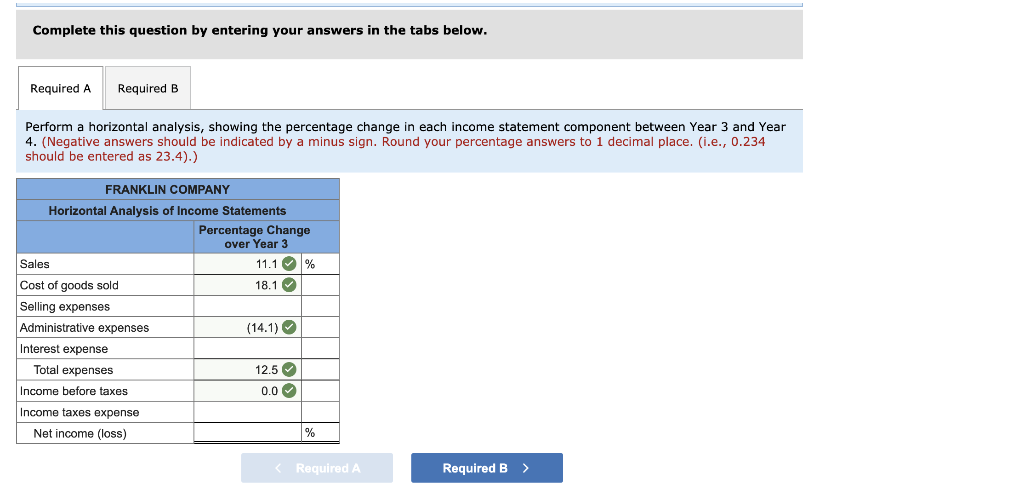
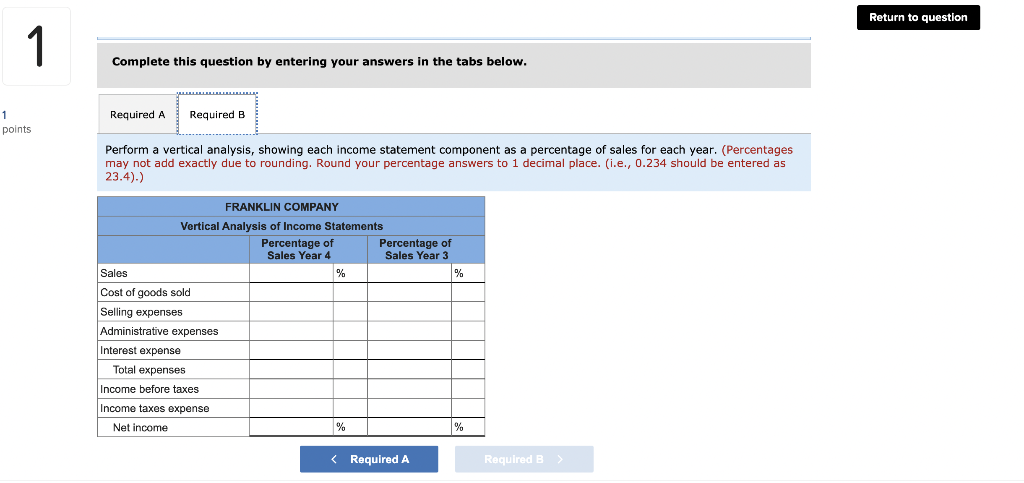
Check my work 1 Problem: Module 4 Textbook Problem 1 Learning Objective: 4-1 Differentiate between horizontal and vertical analysis Income statements for Franklin Company for
Step by Step Solution
There are 3 Steps involved in it
Step: 1

Get Instant Access to Expert-Tailored Solutions
See step-by-step solutions with expert insights and AI powered tools for academic success
Step: 2

Step: 3
Ace Your Homework with AI
Get the answers you need in no time with our AI-driven, step-by-step assistance
Get Started
Frank Woods Business Accounting
Authors: Frank Wood, Alan Sangster
9th Edition
0273655523, 9780273655527