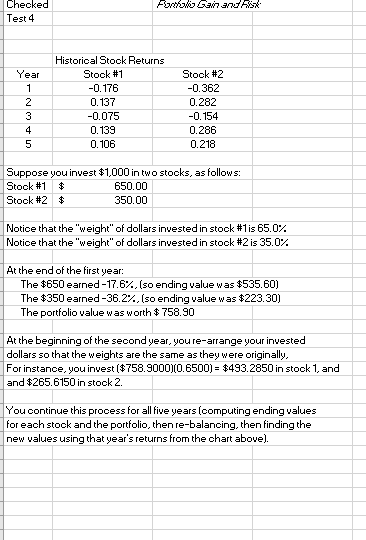
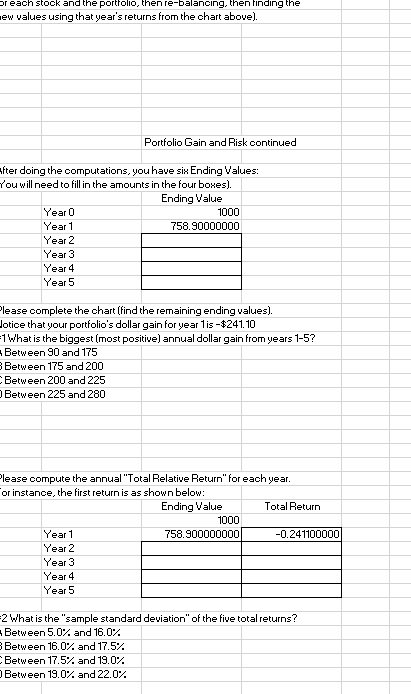
Checked Fonholio Gainand Fisk Test 4 Historical Stock Returns Year Stock #1 Stock #2 -0.362 -0.176 0.137 0.282 3 -0.075 -0.154 4 0.139 0.286 0.106 0.218 Suppose you invest $1,000 in two stocks, as follows: 650.00 Stock #1 Stock #2 $ 350.00 Notice that the "weight" of dollars invested in stock #1is 65.0% Notice that the "weight" of dollars invested in stock #2 is 35.0% At the end of the first year: The $650 earned-17.6%,(so ending value was $535.60) The $350 earned-36.2%,(so ending value was $223.30) The portfolio value was worth $ 758.90 At the beginning of the second year, you re-arrange your invested dollars so that the weights are the same as they were originally, For instance, you invest ($758.S9000)(0.6500) = $493.2850 in stock 1, and and $265.6150 in stock 2. You continue this process for all five years (computing ending values for each stock and the portfolio, then re-balancing, then finding the new values using that year's returns from the chart above). preach stock and the portfolio, then re-balancing, then finding the ew values using that year's returns from the chart above). Portfolio Gain and Risk continued nfter doing the computations, you have six Ending Values: Youwill need to fill in the amounts in the four boxes). Ending Value Year 0 1000 Year 1 758.90000000 Year 2 Year 3 Year 4 Year 5 Please complete the chart (find the remaining ending values). Jotice that your portfolio's dollar gain for year lis -$241.10 1What is the biggest (most positive) annual dollar gain from years 1-5? Between 90 and 175 B Between 175 and 200 Between 200 and 225 DBetween 225 and 280 Please compute the annual "Total Relative Return" for each year. or instance, the first return is as shown below: Ending Value Total Return 1000 Year 1 758.900000000 -0.241100000 Year 2 Year 3 Year 4 Year 5 2What is the "sample standard deviation" of the five total returns? Between 5.0% and 16.0% 3Between 16.0% and 17.5% Between 17.5%. and 19.0% Between 19.0%. and 22.0% Checked Fonholio Gainand Fisk Test 4 Historical Stock Returns Year Stock #1 Stock #2 -0.362 -0.176 0.137 0.282 3 -0.075 -0.154 4 0.139 0.286 0.106 0.218 Suppose you invest $1,000 in two stocks, as follows: 650.00 Stock #1 Stock #2 $ 350.00 Notice that the "weight" of dollars invested in stock #1is 65.0% Notice that the "weight" of dollars invested in stock #2 is 35.0% At the end of the first year: The $650 earned-17.6%,(so ending value was $535.60) The $350 earned-36.2%,(so ending value was $223.30) The portfolio value was worth $ 758.90 At the beginning of the second year, you re-arrange your invested dollars so that the weights are the same as they were originally, For instance, you invest ($758.S9000)(0.6500) = $493.2850 in stock 1, and and $265.6150 in stock 2. You continue this process for all five years (computing ending values for each stock and the portfolio, then re-balancing, then finding the new values using that year's returns from the chart above). preach stock and the portfolio, then re-balancing, then finding the ew values using that year's returns from the chart above). Portfolio Gain and Risk continued nfter doing the computations, you have six Ending Values: Youwill need to fill in the amounts in the four boxes). Ending Value Year 0 1000 Year 1 758.90000000 Year 2 Year 3 Year 4 Year 5 Please complete the chart (find the remaining ending values). Jotice that your portfolio's dollar gain for year lis -$241.10 1What is the biggest (most positive) annual dollar gain from years 1-5? Between 90 and 175 B Between 175 and 200 Between 200 and 225 DBetween 225 and 280 Please compute the annual "Total Relative Return" for each year. or instance, the first return is as shown below: Ending Value Total Return 1000 Year 1 758.900000000 -0.241100000 Year 2 Year 3 Year 4 Year 5 2What is the "sample standard deviation" of the five total returns? Between 5.0% and 16.0% 3Between 16.0% and 17.5% Between 17.5%. and 19.0% Between 19.0%. and 22.0%