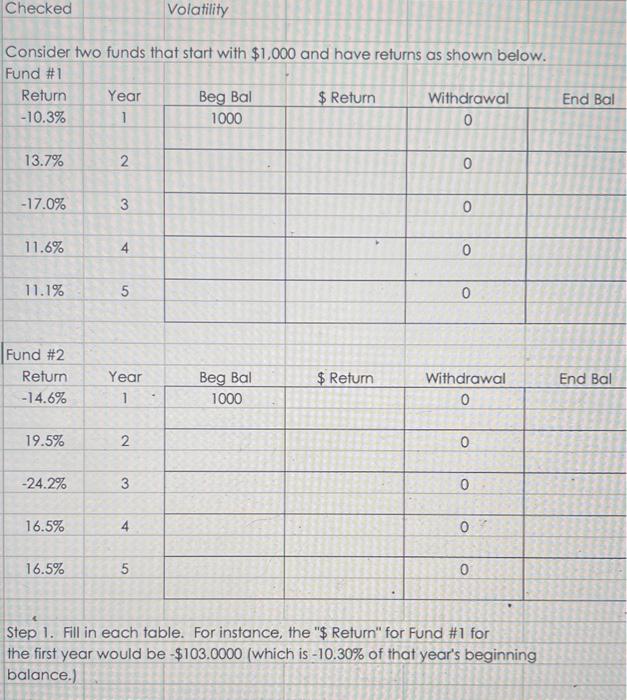
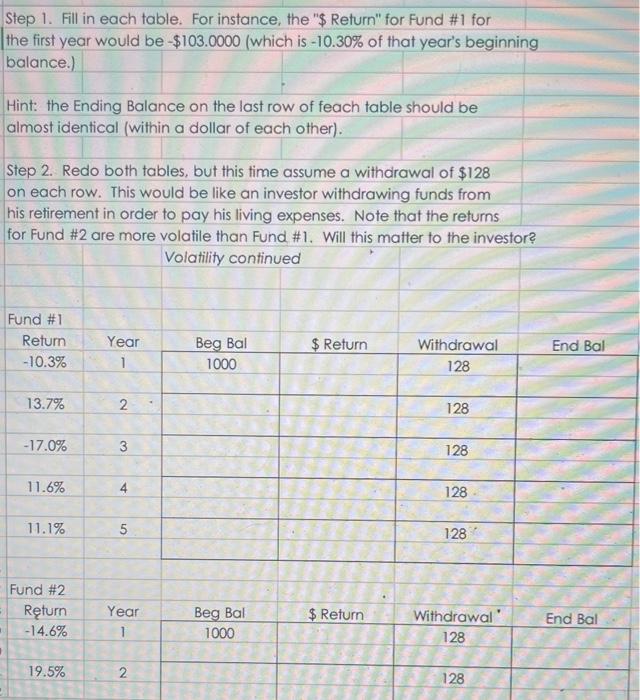
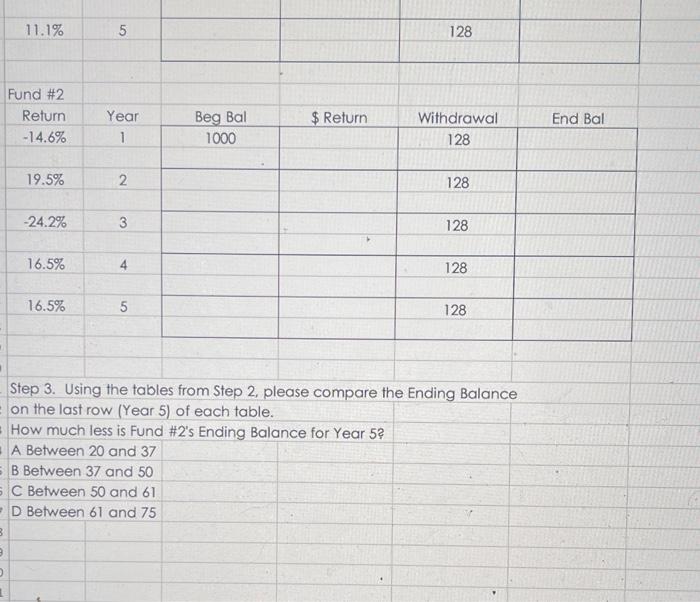
Checked Volatility Consider two funds that start with $1,000 and have returns as shown below. Fund \#1 \begin{tabular}{|c|c|c|c|c|c|} \hline Return & Year & Beg Bal & \$Return & Withdrawal & End Bal \\ \hline10.3% & 1 & 1000 & & 0 & \\ \hline & & & & 0 & \\ \hline 13.7% & 2 & & & 0 & \\ \hline17.0% & 3 & & & 0 & \\ \hline 11.6% & 4 & & & & 0 \\ \hline 11.1% & 5 & & & & \\ \hline \end{tabular} Fund \#2 \begin{tabular}{|c|c|c|c|c|c|} \hline Return & Year & Beg Bal & \$Retum & Withdrawal & End Bal \\ \hline14.6% & 1 & 1000 & & 0 & \\ \hline 19.5% & 2 & & & 0 & \\ \hline24.2% & 3 & & & 0 & \\ \hline 16.5% & 4 & & & 0 & \\ \hline 16.5% & 5 & & & 0 & \end{tabular} Step 1. Fill in each table. For instance, the "\$ Return" for Fund \#1 for the first year would be $103.0000 (which is 10.30% of that year's beginning balance.) Step 1. Fill in each table. For instance, the "\$ Return" for Fund #1 for the first year would be $103.0000 (which is 10.30% of that year's beginning balance.) Hint: the Ending Balance on the last row of feach table should be almost identical (within a dollar of each other). Step 2. Redo both tables, but this time assume a withdrawal of $128 on each row. This would be like an investor withdrawing funds from his retirement in order to pay his living expenses. Note that the returns for Fund \#2 are more volatile than Fund \#1. Will this matter to the investor? Volatility continued Fund \#1 \begin{tabular}{|c|c|c|c|c|c|} \hline Return & Year & Beg Bal & \$Return & Withdrawal & End Bal \\ \hline10.3% & 1 & 1000 & & 128 & \\ \hline 13.7% & 2 & & & 128 & \\ \hline17.0% & 3 & & & 128 & \\ \hline 11.6% & 4 & & & & \\ \hline 11.1% & 5 & & & 128 & \\ \hline \end{tabular} Fund \#2 \begin{tabular}{|c|c|c|c|c|c|} \hline Rturn & Year & Beg Bal & \$Return & Withdrawal & End Bal \\ \hline14.6% & 1 & 1000 & & 128 & \\ \hline 19.5% & 2 & & & & \\ \hline \end{tabular} Fund \#2 \begin{tabular}{|c|c|c|c|c|c|} \hline Return & Year & Beg Bal & \$Return & Withdrawal & End Bal \\ \hline14.6% & 1 & 1000 & & 128 & \\ \hline 19.5% & 2 & & & 128 & \\ \hline24.2% & 3 & & & & \\ \hline 16.5% & 4 & & & 128 & \\ \hline 16.5% & 5 & & & 128 & \\ \hline \end{tabular} Step 3. Using the tables from Step 2, please compare the Ending Balance on the last row (Year 5) of each table. How much less is Fund \#2's Ending Balance for Year 5 ? A Between 20 and 37 B Between 37 and 50 C Between 50 and 61 D Between 61 and 75