Question
Checking my answers this is my first semester using SPSS and its confusing to me. Problem Set 1: Chi Square Test of Goodness of Fit
Checking my answers this is my first semester using SPSS and its confusing to me.
Problem Set 1: Chi Square Test of Goodness of Fit
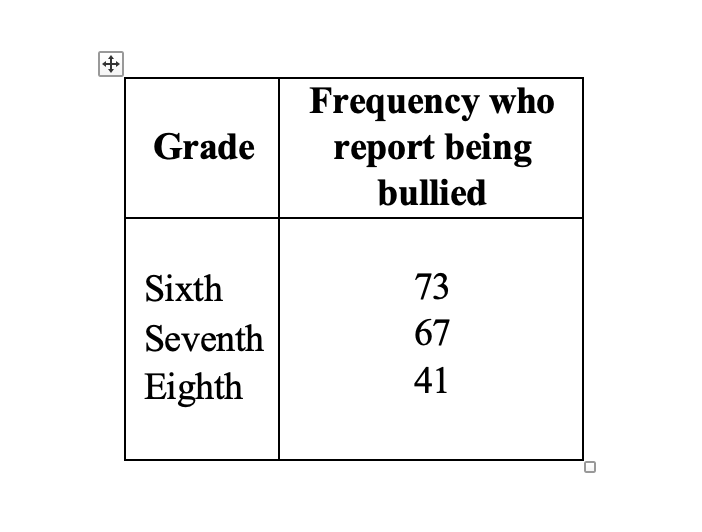
Research Scenario: A school social worker at a middle school wants to examine whether there is a difference in the number of children who have experienced bullying in different grades (6th - 8th). Assume the total number of children in each grade is about equal. He administers a survey on which students self-report whether or not they have been bullied. He is only interested in the number of "yes" responses from students who report being victims of bullying. He records the frequencies of "yes" answers in the table below.
Using this table, enter the data into a new SPSS data file and run a Chi Square Test of Goodness of Fit to test whether the frequencies of being bullied are equal across the different grades. Remember to weight cases as shown in the presentation. bar chart to show the relationship between the variables.
- Paste SPSS output.
- Results section based on your analysis including independent and dependent variables, confidence interval, effect size, 1 or 2 tailed and the p value.


Step by Step Solution
There are 3 Steps involved in it
Step: 1

Get Instant Access to Expert-Tailored Solutions
See step-by-step solutions with expert insights and AI powered tools for academic success
Step: 2

Step: 3

Ace Your Homework with AI
Get the answers you need in no time with our AI-driven, step-by-step assistance
Get Started


