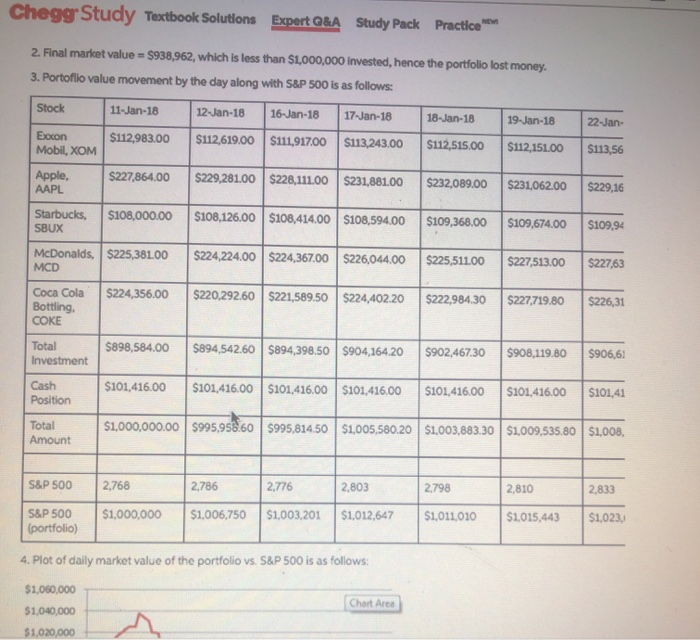
Chegg Study Textbook Solutions Expert Q&A Study Pack Practice 2. Final market value = $938,962, which is less than $1,000,000 invested, hence the portfolio lost money. 3. Portoflio value movement by the day along with S&P 500 is as follows: Stock 11-Jan-18 12-Jan-18 16-Jan-18 17-Jan-18 18-Jan-18 19-Jan-18 22-Jan- Exocon Mobil, XOM $112,983.00 $112,619.00 $111.917.00 $113,243.00 $112,515.00 $112, 151.00 $113,56 Apple, AAPL $227,864.00 $229,281.00 $228,111.00 $231,881.00 $232,089.00 $231,062.00 $229,16 Starbucks, SBUX $108,000.00 $108,126.00 $108,414.00 $108,594.00 $109,368.00 $109,674.00 $109,94 McDonalds, $225,381.00 MCD $224,224.00 $224,367.00 $226,044.00 $225,511.00 $227,513.00 $227,63 $224,356.00 $220,292.60 $221,589.50 $224,402.20 Coca Cola Bottling COKE $222,984.30 $227,719.80 $226,31 Total Investment $898,584.00 $894,542.60 $894,398.50 $904,164.20 $902.467.30 $908,119.80 $906,61 Cash Position $101,416.00 $101,416.00 5101,416.00 $101,416.00 $101,416.00 $101,416.00 $101,41 Total Amount $1,000,000.00 $995,958.60 995,814.50 $1,005,580.20 $1,003,883.30 $1,009,535.80 $1,008, S&P 500 2,768 2,786 2,776 2.803 2.798 2,810 2.833 $1,000,000 $1,006,750 S&P 500 (portfolio) $1,003,201 $1,012,647 $1,011,010 $1,015,443 $1,023, 4. Plot of daily market value of the portfolio vs. S&P 500 is as follows: $1,060,000 Chart Area $1,040,000 $1,020,000 Chegg Study Textbook Solutions Expert Q&A Study Pack Practice 2. Final market value = $938,962, which is less than $1,000,000 invested, hence the portfolio lost money. 3. Portoflio value movement by the day along with S&P 500 is as follows: Stock 11-Jan-18 12-Jan-18 16-Jan-18 17-Jan-18 18-Jan-18 19-Jan-18 22-Jan- Exocon Mobil, XOM $112,983.00 $112,619.00 $111.917.00 $113,243.00 $112,515.00 $112, 151.00 $113,56 Apple, AAPL $227,864.00 $229,281.00 $228,111.00 $231,881.00 $232,089.00 $231,062.00 $229,16 Starbucks, SBUX $108,000.00 $108,126.00 $108,414.00 $108,594.00 $109,368.00 $109,674.00 $109,94 McDonalds, $225,381.00 MCD $224,224.00 $224,367.00 $226,044.00 $225,511.00 $227,513.00 $227,63 $224,356.00 $220,292.60 $221,589.50 $224,402.20 Coca Cola Bottling COKE $222,984.30 $227,719.80 $226,31 Total Investment $898,584.00 $894,542.60 $894,398.50 $904,164.20 $902.467.30 $908,119.80 $906,61 Cash Position $101,416.00 $101,416.00 5101,416.00 $101,416.00 $101,416.00 $101,416.00 $101,41 Total Amount $1,000,000.00 $995,958.60 995,814.50 $1,005,580.20 $1,003,883.30 $1,009,535.80 $1,008, S&P 500 2,768 2,786 2,776 2.803 2.798 2,810 2.833 $1,000,000 $1,006,750 S&P 500 (portfolio) $1,003,201 $1,012,647 $1,011,010 $1,015,443 $1,023, 4. Plot of daily market value of the portfolio vs. S&P 500 is as follows: $1,060,000 Chart Area $1,040,000 $1,020,000