Answered step by step
Verified Expert Solution
Question
1 Approved Answer
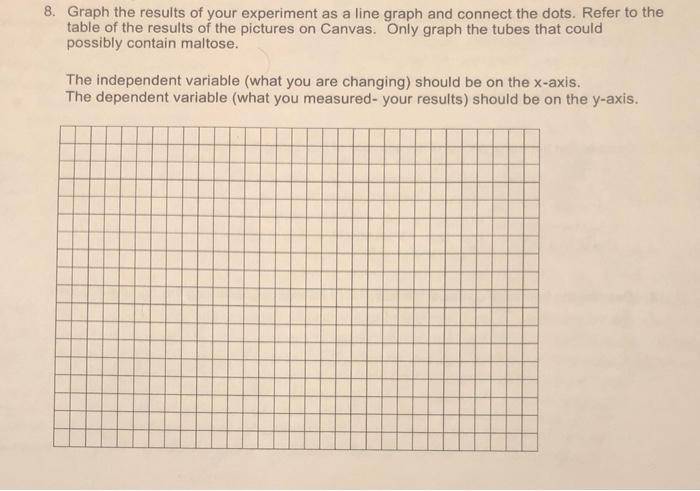
8. Graph the results of your experiment as a line graph and connect the dots. Refer to the table of the results of the

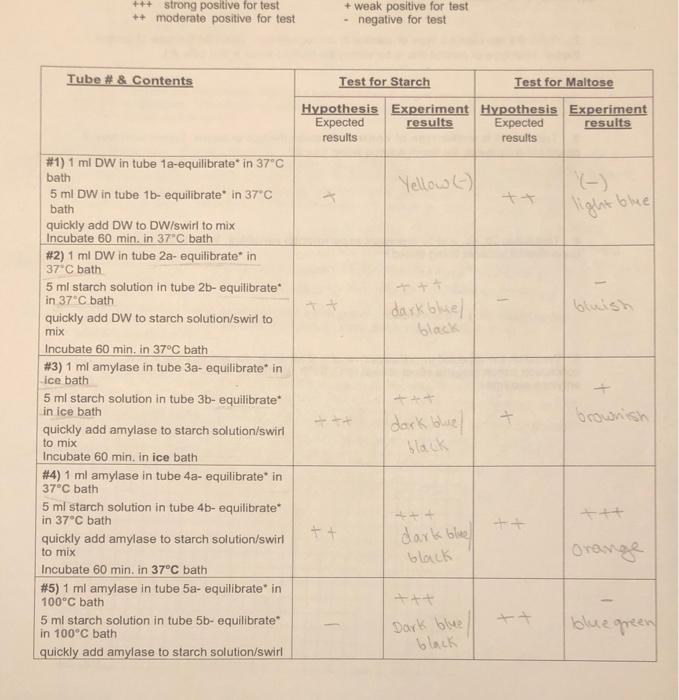
8. Graph the results of your experiment as a line graph and connect the dots. Refer to the table of the results of the pictures on Canvas. Only graph the tubes that could possibly contain maltose. The independent variable (what you are changing) should be on the x-axis. The dependent variable (what you measured- your results) should be on the y-axis. +++ strong positive for test ++moderate positive for test Tube # & Contents #1) 1 ml DW in tube 1a-equilibrate in 37C bath 5 ml DW in tube 1b- equilibrate in 37C bath quickly add DW to DW/swirl to mix Incubate 60 min. in 37C bath # 2) 1 ml DW in tube 2a- equilibrate* in 37C bath 5 ml starch solution in tube 2b- equilibrate* in 37C bath quickly add DW to starch solution/swirl to mix Incubate 60 min. in 37C bath # 3) 1 ml amylase in tube 3a- equilibrate* in ice bath 5 ml starch solution in tube 3b- equilibrate* in ice bath quickly add amylase to starch solution/swirl to mix Incubate 60 min. in ice bath # 4) 1 ml amylase in tube 4a- equilibrate* in 37C bath 5 ml starch solution in tube 4b- equilibrate* in 37C bath quickly add amylase to starch solution/swirl to mix Incubate 60 min. in 37C bath # 5) 1 ml amylase in tube 5a- equilibrate* in 100C bath 5 ml starch solution in tube 5b-equilibrate in 100C bath quickly add amylase to starch solution/swirl + weak positive for test negative for test ++ Test for Starch Test for Maltose Hypothesis Experiment Hypothesis Experiment Expected results results Expected results results Yellow) ++ dark blue/ black +++ dark blue black dark blue black Dark blue black ++ (-) light blue/ brownish Orange blue green
Step by Step Solution
★★★★★
3.47 Rating (163 Votes )
There are 3 Steps involved in it
Step: 1
The skin friction coefficient Cf for a laminar boundary ...
Get Instant Access to Expert-Tailored Solutions
See step-by-step solutions with expert insights and AI powered tools for academic success
Step: 2

Step: 3

Ace Your Homework with AI
Get the answers you need in no time with our AI-driven, step-by-step assistance
Get Started


