

Answered step by step
Verified Expert Solution
Question
1 Approved Answer
Chiara Company's management has made the projections shown in the Table as follow. Historical Year 1. Sales 2. Cost of goods sold 3. Other costs
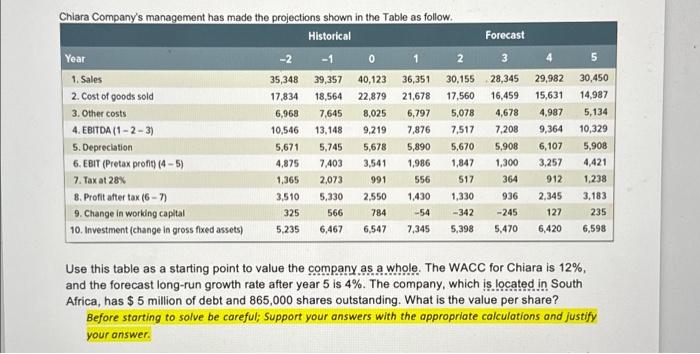
Chiara Company's management has made the projections shown in the Table as follow. Historical Year 1. Sales 2. Cost of goods sold 3. Other costs 4. EBITDA (1-2-3) 5. Depreciation 6. EBIT (Pretax profit) (4-5) 7. Tax at 28% 8. Profit after tax (6-7) 9. Change in working capital 10. Investment (change in gross fixed assets) -2 35,348 17,834 6,968 10,546 5,671 4,875 1,365 3,510 325 5,235 Forecast -1 0 1 2 39,357 40,123 36,351 30,155 28,345 29,982 18,564 22,879 21,678 17,560 16,459 15,631 7,645 8,025 6,797 5,078 4,678 4,987 13,148 9,364 9,219 7,876 7,517 5,678 7,403 3,541 7,208 5,908 6,107 5,745 5,890 5,670 1,986 1,847 1,300 3,257 2,073 991 556 517 364 912 5,330 2,550 936 2,345 1,430 1,330 -54 -342 -245 7,345 5,398 5,470 6,420 566 784 6,467 6,547 127 5 30,450 14,987 5,134 10,329 5,908 4,421 1,238 3,183 235 6,598 Use this table as a starting point to value the company as a whole. The WACC for Chiara is 12%, and the forecast long-run growth rate after year 5 is 4%. The company, which is located in South Africa, has $ 5 million of debt and 865,000 shares outstanding. What is the value per share? Before starting to solve be careful; Support your answers with the appropriate calculations and justify your answer.
Step by Step Solution
There are 3 Steps involved in it
Step: 1

Get Instant Access to Expert-Tailored Solutions
See step-by-step solutions with expert insights and AI powered tools for academic success
Step: 2

Step: 3
Ace Your Homework with AI
Get the answers you need in no time with our AI-driven, step-by-step assistance
Get Started
Handbook Of Experimental Finance
Authors: Sascha Füllbrunn, Ernan Haruvy
1st Edition
1800372329, 978-1800372320