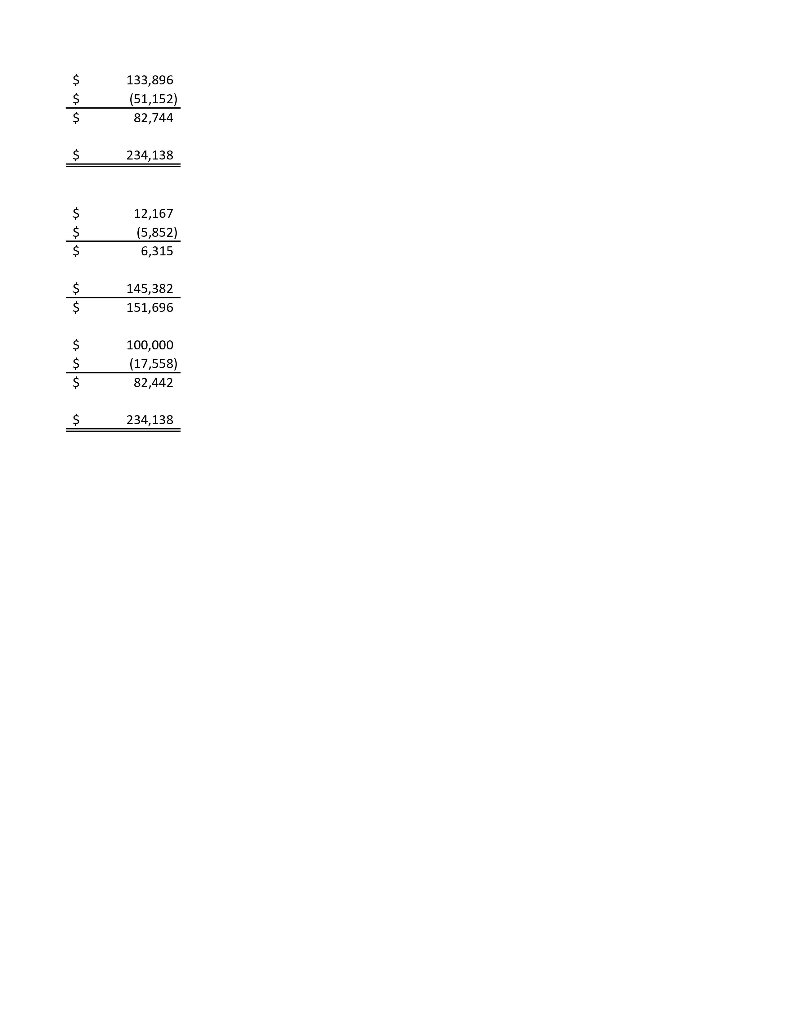
Chips (Year 2) Assignment Names In Group: Part 1 Part 1 (Budget Variance Analysis) 1. I would like to see some budget variance analysis (actual results vs. budget). Show the variance vs. budget in dollars and percentages for the Income Statement and Balance Sheet. The spreadsheet has been set up for you to do so. Calculate the $ and % variances in the spreadsheet. For the $ calculations, use Actual $ minus Budget $. For the % calculations, calculate the % difference (Actual $ minus Budget $) divided by the Budget $). 2. Use the results and budgets on the Revenue tab of the spreadsheet to analyze why revenue exceeded budget. Your analysis should be in the format as presented in Canvas. Summarize briefly why our actual revenue exceeded our budget revenue. 3. To further analyze revenue, do a Price Volume Mix analysis for each store's Actual vs. Budget revenue. 4. Gross Margin $ was higher than budget but Gross Margin % was lower than budget. Why? Analyze the Gross Margin per cookie (Average Price, Average Material Cost, Average Labor Cost, Average Total Cost of Sales) to explain your answer. 5. Operating Expenses finished higher than budget. List the 3 items that were over budget the most in $)? How much was each of these items over budget in $ and %? Did you see any other items of concern? Part 2 (Year-to-Year Variance Analysis) 1. 2. Perform Year-to-Year Variance Analysis comparing 2021 Actual Results to 2020 Actual Results (This Year vs. Last Year). Complete the Actual 2021 Results vs. Last Year sections of the spreadsheet. For the $ calculations, use Actual This Year $ minus Actual Last Year $. For the '%calculations, calculate the difference (Actual This Year Sminus Actual Last Year $) divided by Last Year $). It looks like we were successful in reducing our Long-Term Debt from last year's balance. Analyze the change from last year's Long-Term Debt (decrease of $86,480 from last year). Net Profit plus depreciation was one factor. What were the 2 biggest contributors on the Balance Sheet to the decrease this year compared to last year. Show each item {Net Profit plus depreciation, plus 2 balance sheet items and the amount they contributed to the decrease in Long-Term Debt. 3. What was our sales growth year over year? Your analysis should be in the format presented in Canvas. Summarize briefly why our revenue grew over last year's revenue. 4 Analyze the hours worked and wages paid for our Store-front workers and Bakers by comparing to last year's hours and wages. Your analysis should be in the format presented in Canvas. Briefly summarize your analysis. We had budgeted some increases. Were the increases in line with our budget? Explain. Use graphs to show the changes if helpful. 5 I want the Board of Directors and company to focus on some Key Performance Indicators going forward. Based on your analysis, suggest 3 Key Performance Indicators (KPI) you think we should use to help us manage the business, Chips Income Statement 2021 (Year 2) Actual $ 1,205,195 2021 (Year 2) Budget $ 1,153,441 Revenue $ Material Cost of Goods Sold Labor Cost of Goods Sold Total Cost of Goods Sold Gross Margin Gross Margin % $ S 495,335 190,457 685,792 519,403 43.1% $ $ $ $ 466,301 186,276 652,577 500,864 43.4% $ Operating Expenses Lease Expense Utilities Expense Manager Salary Expense Manager Salary PT&B Expense Hourly Wage Expense Hourly Wage PT&B Expense Marketing Expense Professional Services Expense Office Supplies and Misc Supplies Expense Repairs and Maintenance Expense Insurance Expense Depreciation Expense Total Operating Expenses $ $ $ $ $ $ $ $ $ $ $ $ S 110,931 42,987 122,400 38,475 87,249 5,409 21,545 30,583 2,976 18,257 1,647 13,390 495,849 $ $ $ $ $ $ $ $ $ $ $ $ $ $ 110,931 41,205 122,400 37,942 85,146 5,279 17,800 30,300 3,000 11,500 7,980 13,390 486,873 Earnings Before Interest and Taxes $ 23,554 $ 13,991 Interest Expense Tax Expense Net Income Net Income % $ $ $ 4,712 4,710 14,132 $ $ $ 3,595 2,599 7,797 0.7% 1.2% Chips Balance Sheet Current Assets Cash Accounts Receivable Inventory Total Current Assets S $ $ $ $ 92,737 9,906 20,776 123,419 $ $ $ S 82,995 9,505 15,642 108,142 Equipment and Leasehold Improvements Accumulated Depreciation Tota Fixed Assets $ $ 133,896 (64,542) 69,354 $ $ $ 133,896 (64,542) 69,354 $ Total Assets $ 192,773 $ 177,496 Current Liabilities Accounts Payable Taxes Payable Total Current Liabilities $ $ $ 32,588 4,710 37,298 $ $ $ 36,826 2,599 39,425 Long-term Debt Total Liabilities $ $ 58,902 96,200 $ $ 47,832 87,257 Stock Retained Earnings Total Equity $ $ $ 100,000 (3,427) 96,573 $ $ 100,000 (9,761) 90,239 $ Total Liabilities and Equity $ 192,773 $ 177,496 2020 (Year 1) Actual $ 1,101,368 2021 Actual vs Budget % 2021 Actual vs Budget 2021 Actual vs Last Year 2021 Actual vs Last Year $ $ $ $ 444,094 182,624 626,718 474,650 43.1% $ $ $ $ $ $ $ $ $ 108,756 40,399 120,000 37,198 83,477 5,176 18,497 36,478 2,983 12,479 7,598 13,390 486,430 $ $ $ $ (11,780) 11,631 $ $ $ (5,852) (17,558) -1.6% $ $ $ $ 127,445 9,052 14,897 151,394 $ $ $ 133,896 (51,152) 82,744 $ 234,138 $ $ $ 12,167 (5,852) 6,315 $ $ 145,382 151,696 $ $ $ 100,000 (17,558) 82,442 $ 234,138 Chips (Year 2) Assignment Names In Group: Part 1 Part 1 (Budget Variance Analysis) 1. I would like to see some budget variance analysis (actual results vs. budget). Show the variance vs. budget in dollars and percentages for the Income Statement and Balance Sheet. The spreadsheet has been set up for you to do so. Calculate the $ and % variances in the spreadsheet. For the $ calculations, use Actual $ minus Budget $. For the % calculations, calculate the % difference (Actual $ minus Budget $) divided by the Budget $). 2. Use the results and budgets on the Revenue tab of the spreadsheet to analyze why revenue exceeded budget. Your analysis should be in the format as presented in Canvas. Summarize briefly why our actual revenue exceeded our budget revenue. 3. To further analyze revenue, do a Price Volume Mix analysis for each store's Actual vs. Budget revenue. 4. Gross Margin $ was higher than budget but Gross Margin % was lower than budget. Why? Analyze the Gross Margin per cookie (Average Price, Average Material Cost, Average Labor Cost, Average Total Cost of Sales) to explain your answer. 5. Operating Expenses finished higher than budget. List the 3 items that were over budget the most in $)? How much was each of these items over budget in $ and %? Did you see any other items of concern? Part 2 (Year-to-Year Variance Analysis) 1. 2. Perform Year-to-Year Variance Analysis comparing 2021 Actual Results to 2020 Actual Results (This Year vs. Last Year). Complete the Actual 2021 Results vs. Last Year sections of the spreadsheet. For the $ calculations, use Actual This Year $ minus Actual Last Year $. For the '%calculations, calculate the difference (Actual This Year Sminus Actual Last Year $) divided by Last Year $). It looks like we were successful in reducing our Long-Term Debt from last year's balance. Analyze the change from last year's Long-Term Debt (decrease of $86,480 from last year). Net Profit plus depreciation was one factor. What were the 2 biggest contributors on the Balance Sheet to the decrease this year compared to last year. Show each item {Net Profit plus depreciation, plus 2 balance sheet items and the amount they contributed to the decrease in Long-Term Debt. 3. What was our sales growth year over year? Your analysis should be in the format presented in Canvas. Summarize briefly why our revenue grew over last year's revenue. 4 Analyze the hours worked and wages paid for our Store-front workers and Bakers by comparing to last year's hours and wages. Your analysis should be in the format presented in Canvas. Briefly summarize your analysis. We had budgeted some increases. Were the increases in line with our budget? Explain. Use graphs to show the changes if helpful. 5 I want the Board of Directors and company to focus on some Key Performance Indicators going forward. Based on your analysis, suggest 3 Key Performance Indicators (KPI) you think we should use to help us manage the business, Chips Income Statement 2021 (Year 2) Actual $ 1,205,195 2021 (Year 2) Budget $ 1,153,441 Revenue $ Material Cost of Goods Sold Labor Cost of Goods Sold Total Cost of Goods Sold Gross Margin Gross Margin % $ S 495,335 190,457 685,792 519,403 43.1% $ $ $ $ 466,301 186,276 652,577 500,864 43.4% $ Operating Expenses Lease Expense Utilities Expense Manager Salary Expense Manager Salary PT&B Expense Hourly Wage Expense Hourly Wage PT&B Expense Marketing Expense Professional Services Expense Office Supplies and Misc Supplies Expense Repairs and Maintenance Expense Insurance Expense Depreciation Expense Total Operating Expenses $ $ $ $ $ $ $ $ $ $ $ $ S 110,931 42,987 122,400 38,475 87,249 5,409 21,545 30,583 2,976 18,257 1,647 13,390 495,849 $ $ $ $ $ $ $ $ $ $ $ $ $ $ 110,931 41,205 122,400 37,942 85,146 5,279 17,800 30,300 3,000 11,500 7,980 13,390 486,873 Earnings Before Interest and Taxes $ 23,554 $ 13,991 Interest Expense Tax Expense Net Income Net Income % $ $ $ 4,712 4,710 14,132 $ $ $ 3,595 2,599 7,797 0.7% 1.2% Chips Balance Sheet Current Assets Cash Accounts Receivable Inventory Total Current Assets S $ $ $ $ 92,737 9,906 20,776 123,419 $ $ $ S 82,995 9,505 15,642 108,142 Equipment and Leasehold Improvements Accumulated Depreciation Tota Fixed Assets $ $ 133,896 (64,542) 69,354 $ $ $ 133,896 (64,542) 69,354 $ Total Assets $ 192,773 $ 177,496 Current Liabilities Accounts Payable Taxes Payable Total Current Liabilities $ $ $ 32,588 4,710 37,298 $ $ $ 36,826 2,599 39,425 Long-term Debt Total Liabilities $ $ 58,902 96,200 $ $ 47,832 87,257 Stock Retained Earnings Total Equity $ $ $ 100,000 (3,427) 96,573 $ $ 100,000 (9,761) 90,239 $ Total Liabilities and Equity $ 192,773 $ 177,496 2020 (Year 1) Actual $ 1,101,368 2021 Actual vs Budget % 2021 Actual vs Budget 2021 Actual vs Last Year 2021 Actual vs Last Year $ $ $ $ 444,094 182,624 626,718 474,650 43.1% $ $ $ $ $ $ $ $ $ 108,756 40,399 120,000 37,198 83,477 5,176 18,497 36,478 2,983 12,479 7,598 13,390 486,430 $ $ $ $ (11,780) 11,631 $ $ $ (5,852) (17,558) -1.6% $ $ $ $ 127,445 9,052 14,897 151,394 $ $ $ 133,896 (51,152) 82,744 $ 234,138 $ $ $ 12,167 (5,852) 6,315 $ $ 145,382 151,696 $ $ $ 100,000 (17,558) 82,442 $ 234,138