

Answered step by step
Verified Expert Solution
Question
1 Approved Answer
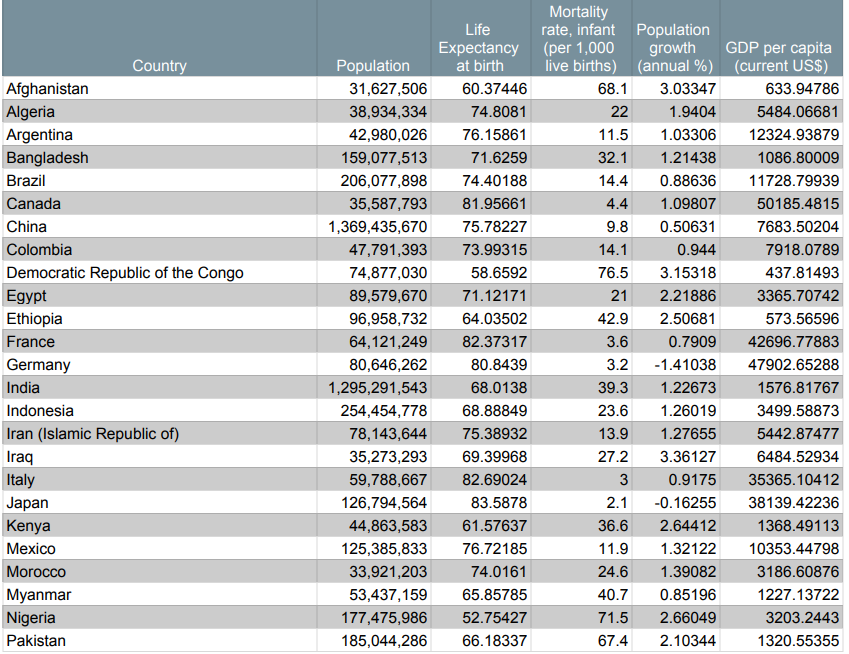
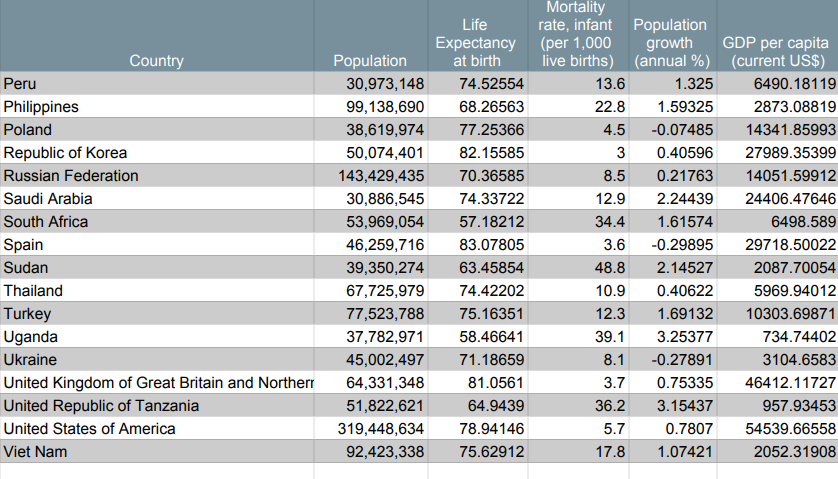
Choose a continuous variable from the Statistics for 42 Countries shown below. Collect data from all 42 countries. You may use data you have used
- Choose a continuous variable from the Statistics for 42 Countries shown below.
- Collect data from all 42 countries. You may use data you have used in the past.
- Copy and paste the data into the spreadsheet in Geogebra.
- use a relative histogram, relative frequency table, and relative frequency polygon. Choose an interval size that best represents the data and justify your choice, using the knowledge developed in this lesson.Save screenshots to your Portfolio.
- use a probability question that you may ask, relevant to an interval on the histogram, that uses multiple histogram bars. Use the frequency table to answer it.
- Under which conditions, related to your choices in the interactive, does the graph/polygon created by the binomial and hypergeometric distributions most closely resemble a normal curve? Include screen shots from the interactive in your explanation.
- Under which conditions, related to interval size and number of data points from the work in Geogebra, does the polygon best represent the data in the histogram? What is required in the collection of the data to ensure these conditions are possible?
Step by Step Solution
There are 3 Steps involved in it
Step: 1

Get Instant Access to Expert-Tailored Solutions
See step-by-step solutions with expert insights and AI powered tools for academic success
Step: 2

Step: 3
Ace Your Homework with AI
Get the answers you need in no time with our AI-driven, step-by-step assistance
Get Started
Calculus
Authors: Dale Varberg, Edwin J. Purcell, Steven E. Rigdon
9th edition
131429248, 978-0131429246