

Question
Choose from the following to finish the sentence that describes the association between the explanatory and response variables as shown in plots. For ex, graph
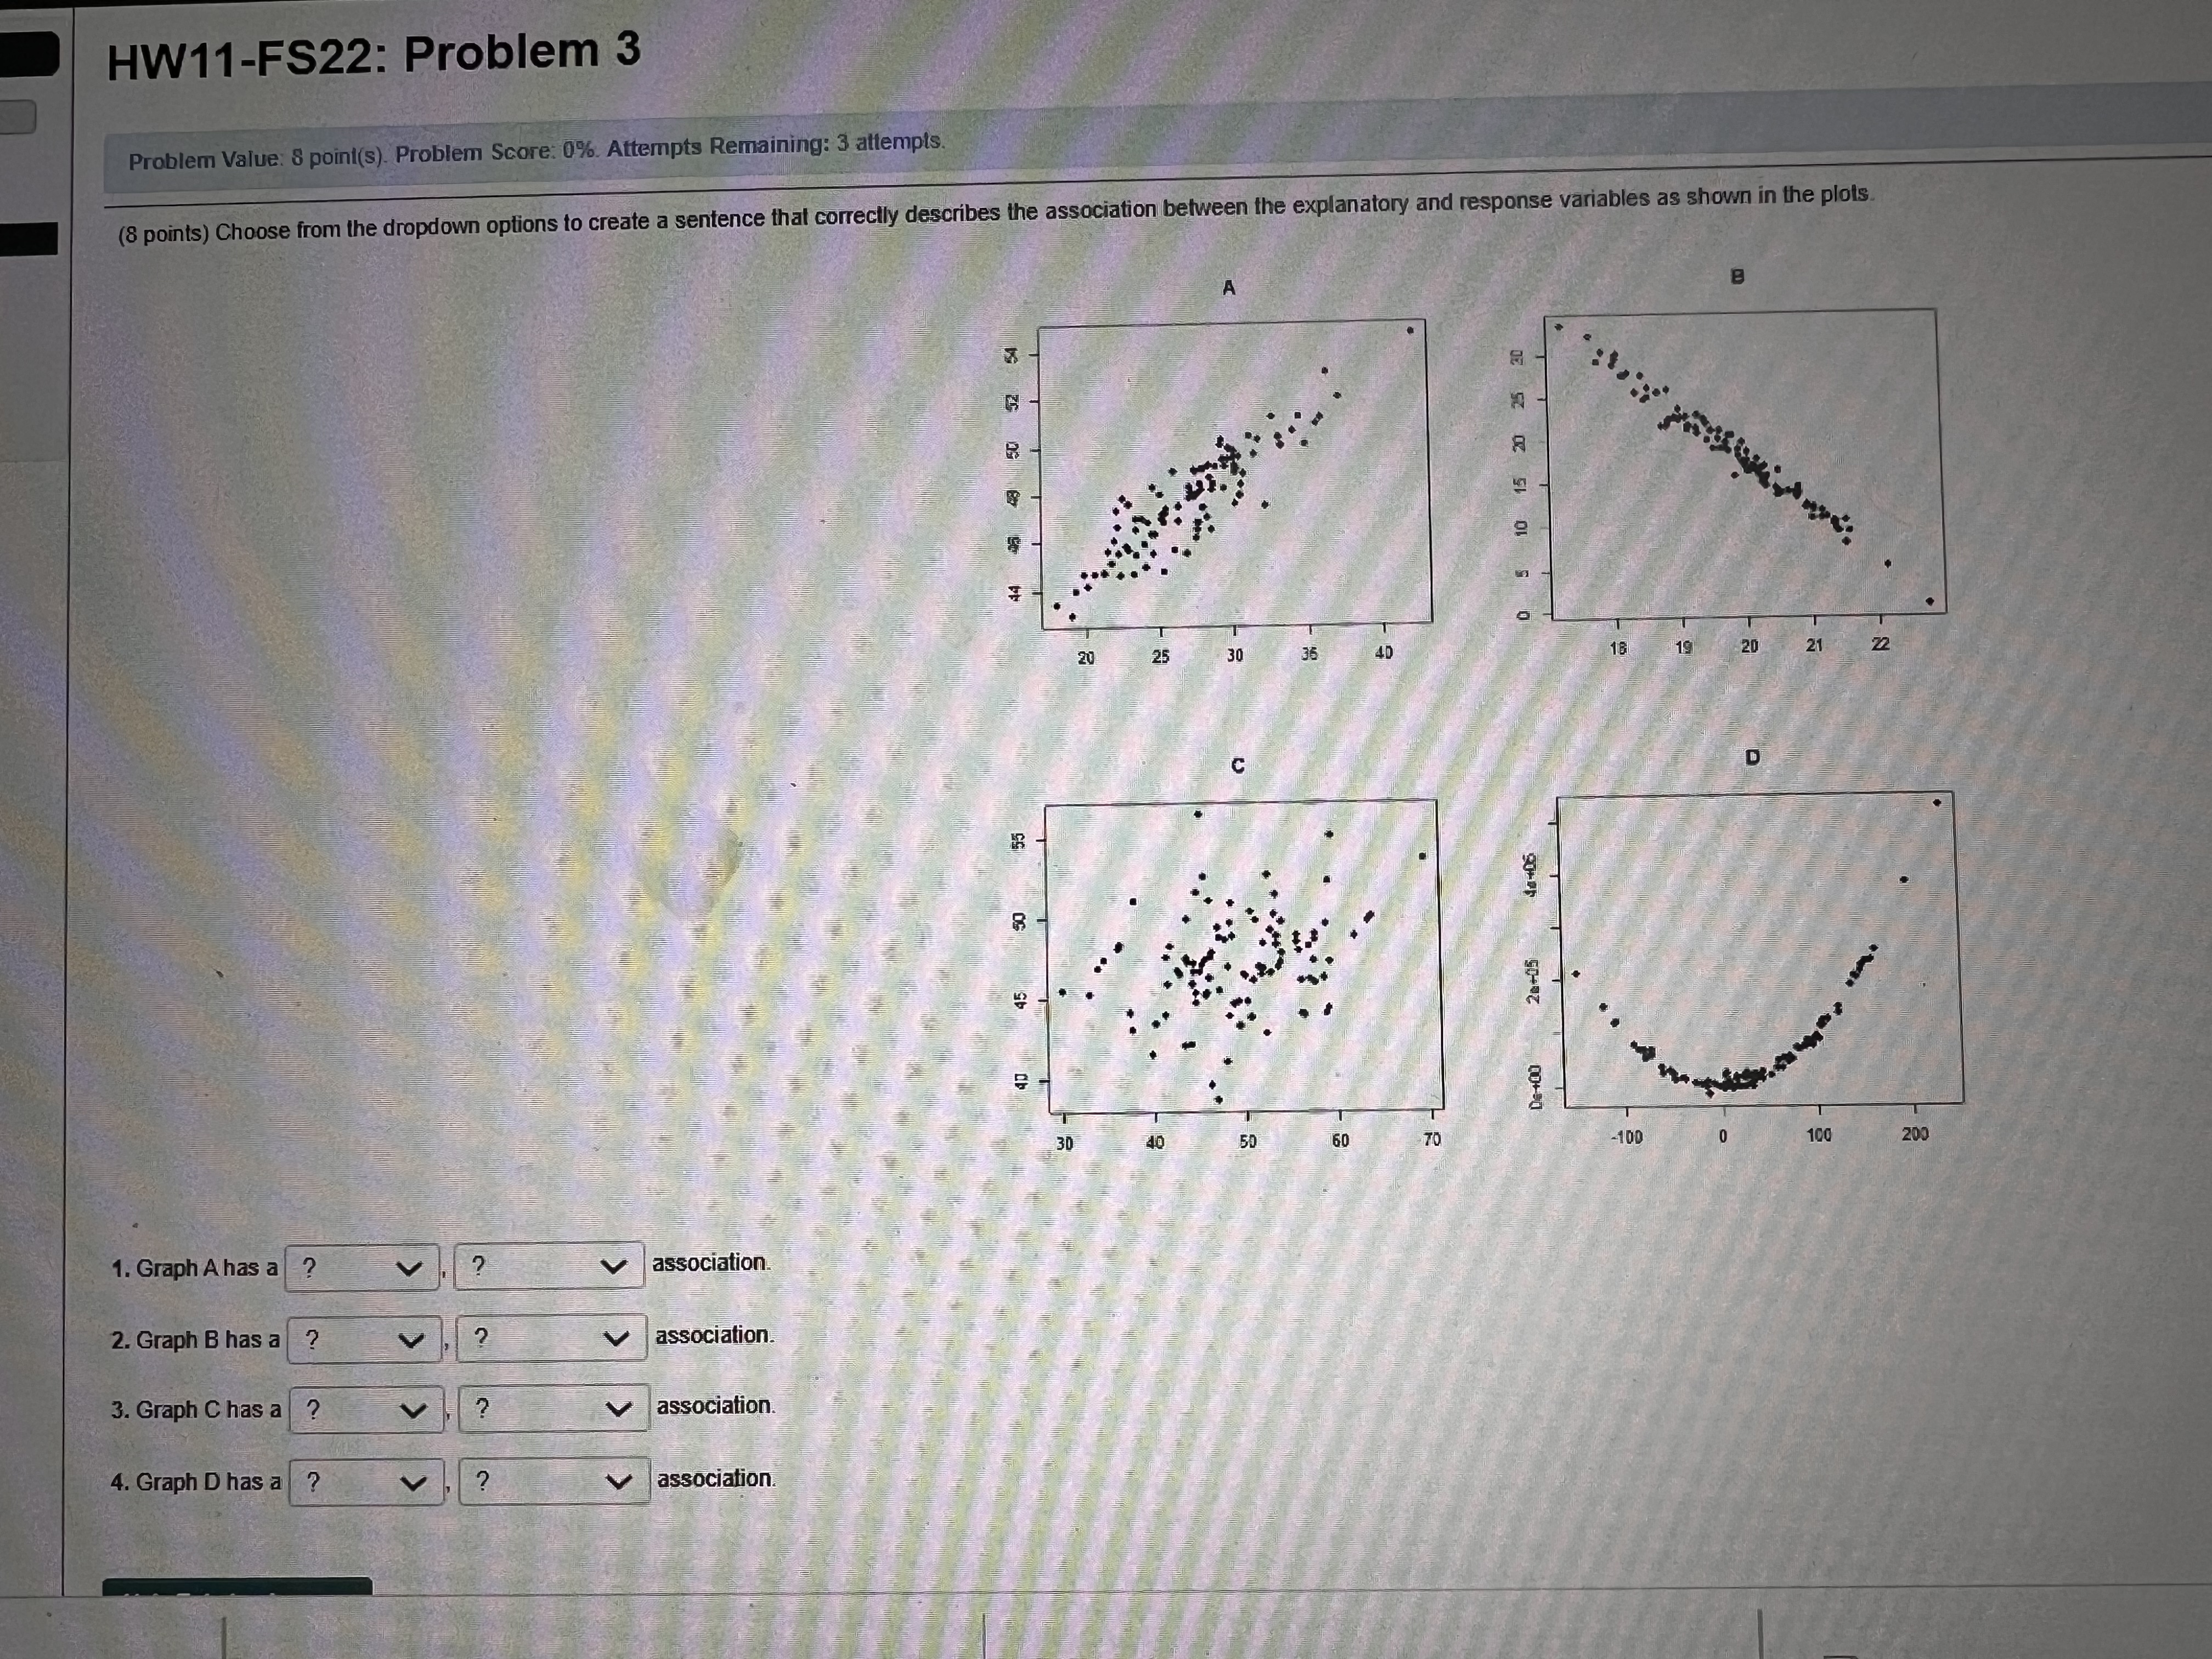
Choose from the following to finish the sentence that describes the association between the explanatory and response variables as shown in plots. For ex, graph A has a (strong or weak) then (positive, linear or non) association.
Step by Step Solution
There are 3 Steps involved in it
Step: 1

Get Instant Access to Expert-Tailored Solutions
See step-by-step solutions with expert insights and AI powered tools for academic success
Step: 2

Step: 3
Ace Your Homework with AI
Get the answers you need in no time with our AI-driven, step-by-step assistance
Get Started
Trigonometry (Subscription)
Authors: Mark Dugopolski
5th Edition
0135207487, 9780135207482