

Answered step by step
Verified Expert Solution
Question
1 Approved Answer
Choose the appropriate scatterplot for the points in the table. 0 XO y 1 1 1.5 1.2 1.6 2 2 3.4 2.7 4.8 3.4
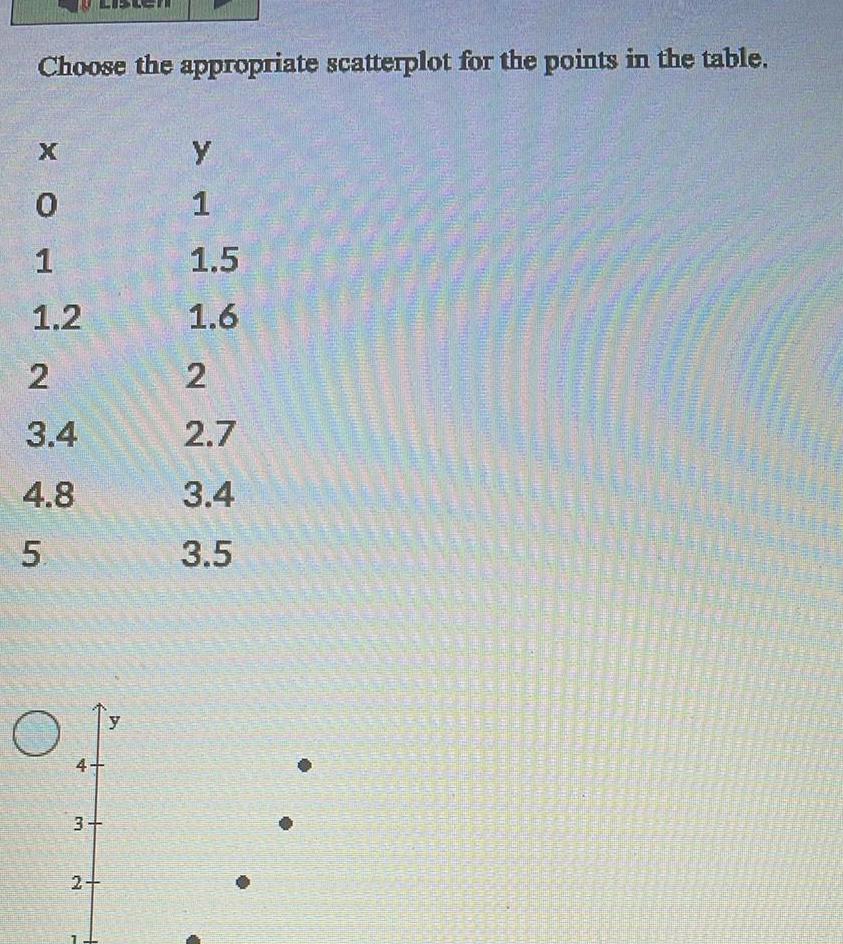
Choose the appropriate scatterplot for the points in the table. 0 XO y 1 1 1.5 1.2 1.6 2 2 3.4 2.7 4.8 3.4 5. 3.5 O 4- y 3+ 2+
Step by Step Solution
There are 3 Steps involved in it
Step: 1

Get Instant Access to Expert-Tailored Solutions
See step-by-step solutions with expert insights and AI powered tools for academic success
Step: 2

Step: 3
Ace Your Homework with AI
Get the answers you need in no time with our AI-driven, step-by-step assistance
Get Started
Quantitative Methods For Business Management And Finance
Authors: Louise Swift, Sally Piff
2nd Edition
1403935289, 9781403935281