

Question
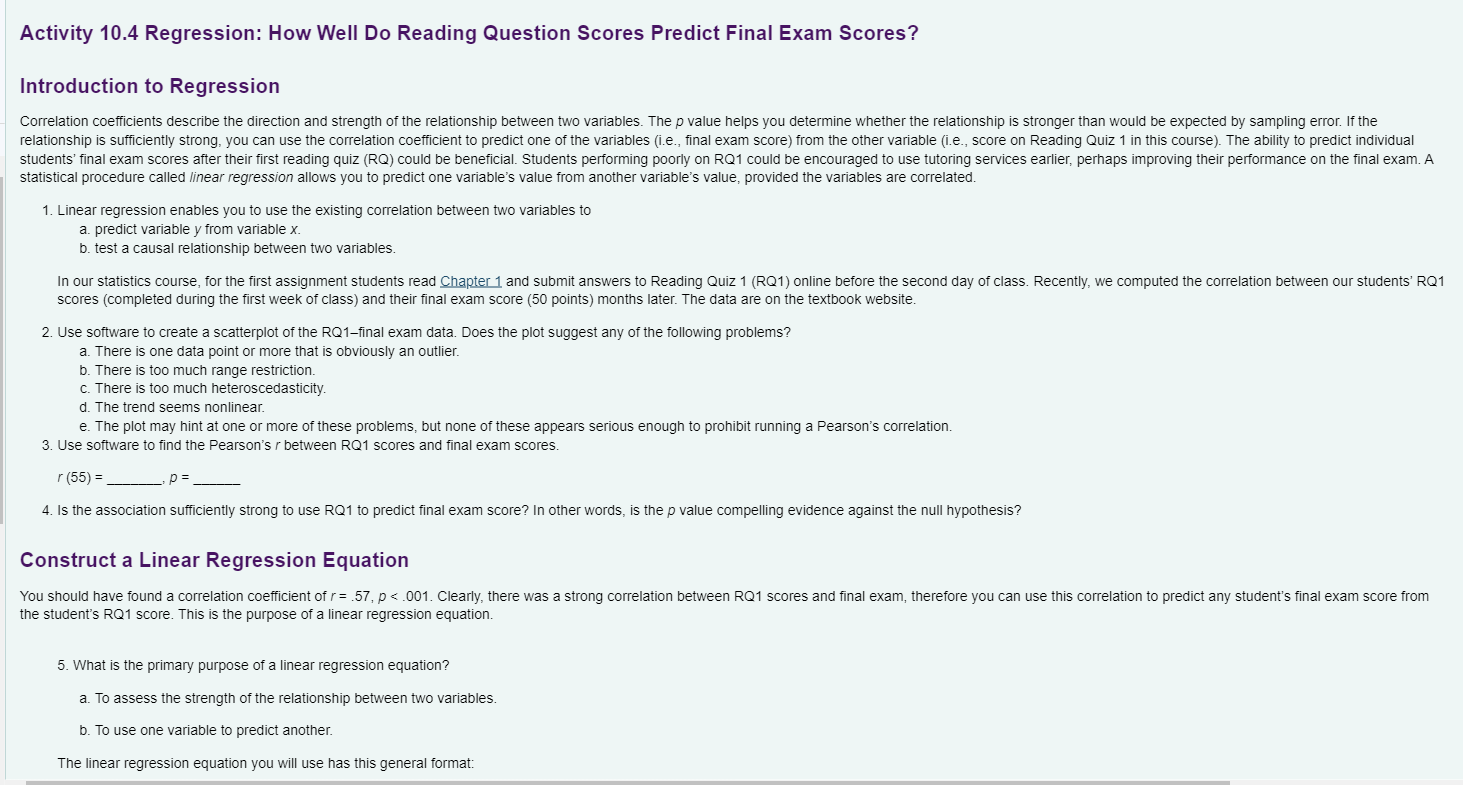
Choose the characteristic of a scatterplot that determines the strength of the bivariate relationship. The closer the data points are to a straight line, the
- Choose the characteristic of a scatterplot that determines the strength of the bivariate relationship.
- The closer the data points are to a straight line, the stronger the relationship.
- The farther the data points are from a straight line, the stronger the relationship.
- The line that best fits the data will have a positive slope for a strong correlation and a negative slope for a weak correlation.
- Choose the characteristic of a scatterplot that determines the direction of the bivariate relationship.
- Data points close to a straight line indicate a positive relationship.
- Data points far from a straight line indicate a positive relationship.
- The line that bests fits the data will have a positive slope for a positive correlation and a negative slope for a negative correlation.
As discussed in the reading, if the scatterplot is linear, use a Pearson's correlation. If the scatterplot is monotonic or "slightly curvy but not dramatically changing its overall trend," use a Spearman's correlation. And if the scatterplot is nonmonotonic or "dramatically changing directions," use neither Pearson's nor Spearman's correlations. The figures below exemplify possible trends and the type of correlation that should be used to analyze them.
Chapter 10 Activity 10.4 - Questions 5-10
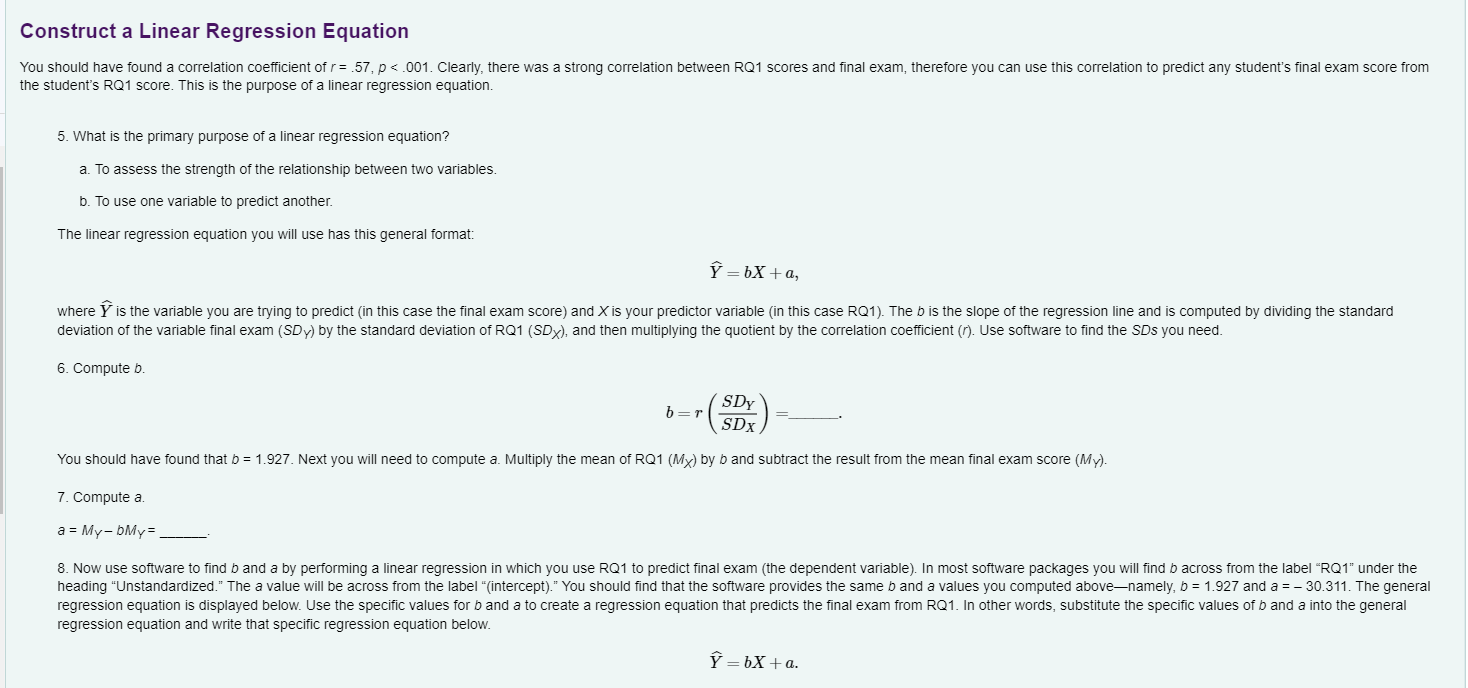
1. What is the primary purpose of a linear regression equation? a. To assess the strength of the relationship between two variables.
b. To use one variable to predict another.
The linear regression equation you will use has this general format:
?^=bX+a,
where ?^ is the variable you are trying to predict (in this case the final exam score) and X is your predictor variable (in this case RQ1). The b is the slope of the regression line and is computed by dividing the standard deviation of the variable final exam (SDY) by the standard deviation of RQ1 (SDX), and then multiplying the quotient by the correlation coefficient (r). Use software to find the SDs you need.
- Compute b.
?=?(??????)=?????????
You should have found that b = 1.927. Next you will need to compute a. Multiply the mean of RQ1 (MX) by b and subtract the result from the mean final exam score (MY).
- Compute a.
a = MY - bMY = ______.
- Now use software to find b and a by performing a linear regression in which you use RQ1 to predict final exam (the dependent variable). In most software packages you will find b across from the label "RQ1" under the heading "Unstandardized." The a value will be across from the label "(intercept)." You should find that the software provides the same b and a values you computed above?namely, b = 1.927 and a = - 30.311. The general regression equation is displayed below. Use the specific values for b and a to create a regression equation that predicts the final exam from RQ1. In other words, substitute the specific values of b and a into the general regression equation and write that specific regression equation below.
?^=bX+a,
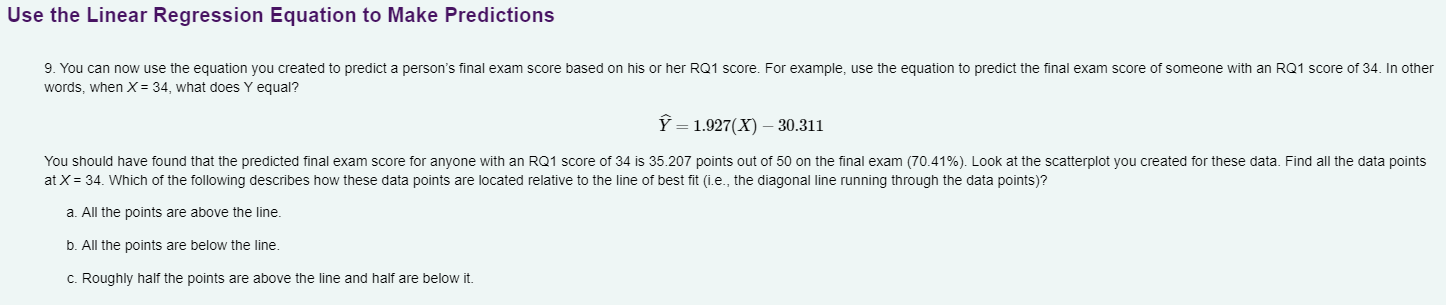
- You can now use the equation you created to predict a person's final exam score based on his or her RQ1 score. For example, use the equation to predict the final exam score of someone with an RQ1 score of 34. In other words, when X = 34, what does Y equal?
?^ = 1.927(X) - 30.311
- You should have found that the predicted final exam score for anyone with an RQ1 score of 34 is 35.207 points out of 50 on the final exam (70.41%). Look at the scatterplot you created for these data. Find all the data points at X = 34. Which of the following describes how these data points are located relative to the line of best fit (i.e., the diagonal line running through the data points)?
- All the points are above the line.
- All the points are below the line.
- Roughly half the points are above the line and half are below it.
Step by Step Solution
There are 3 Steps involved in it
Step: 1

Get Instant Access to Expert-Tailored Solutions
See step-by-step solutions with expert insights and AI powered tools for academic success
Step: 2

Step: 3
Ace Your Homework with AI
Get the answers you need in no time with our AI-driven, step-by-step assistance
Get Started
An Introduction to Analysis
Authors: William R. Wade
4th edition
132296381, 978-0132296380