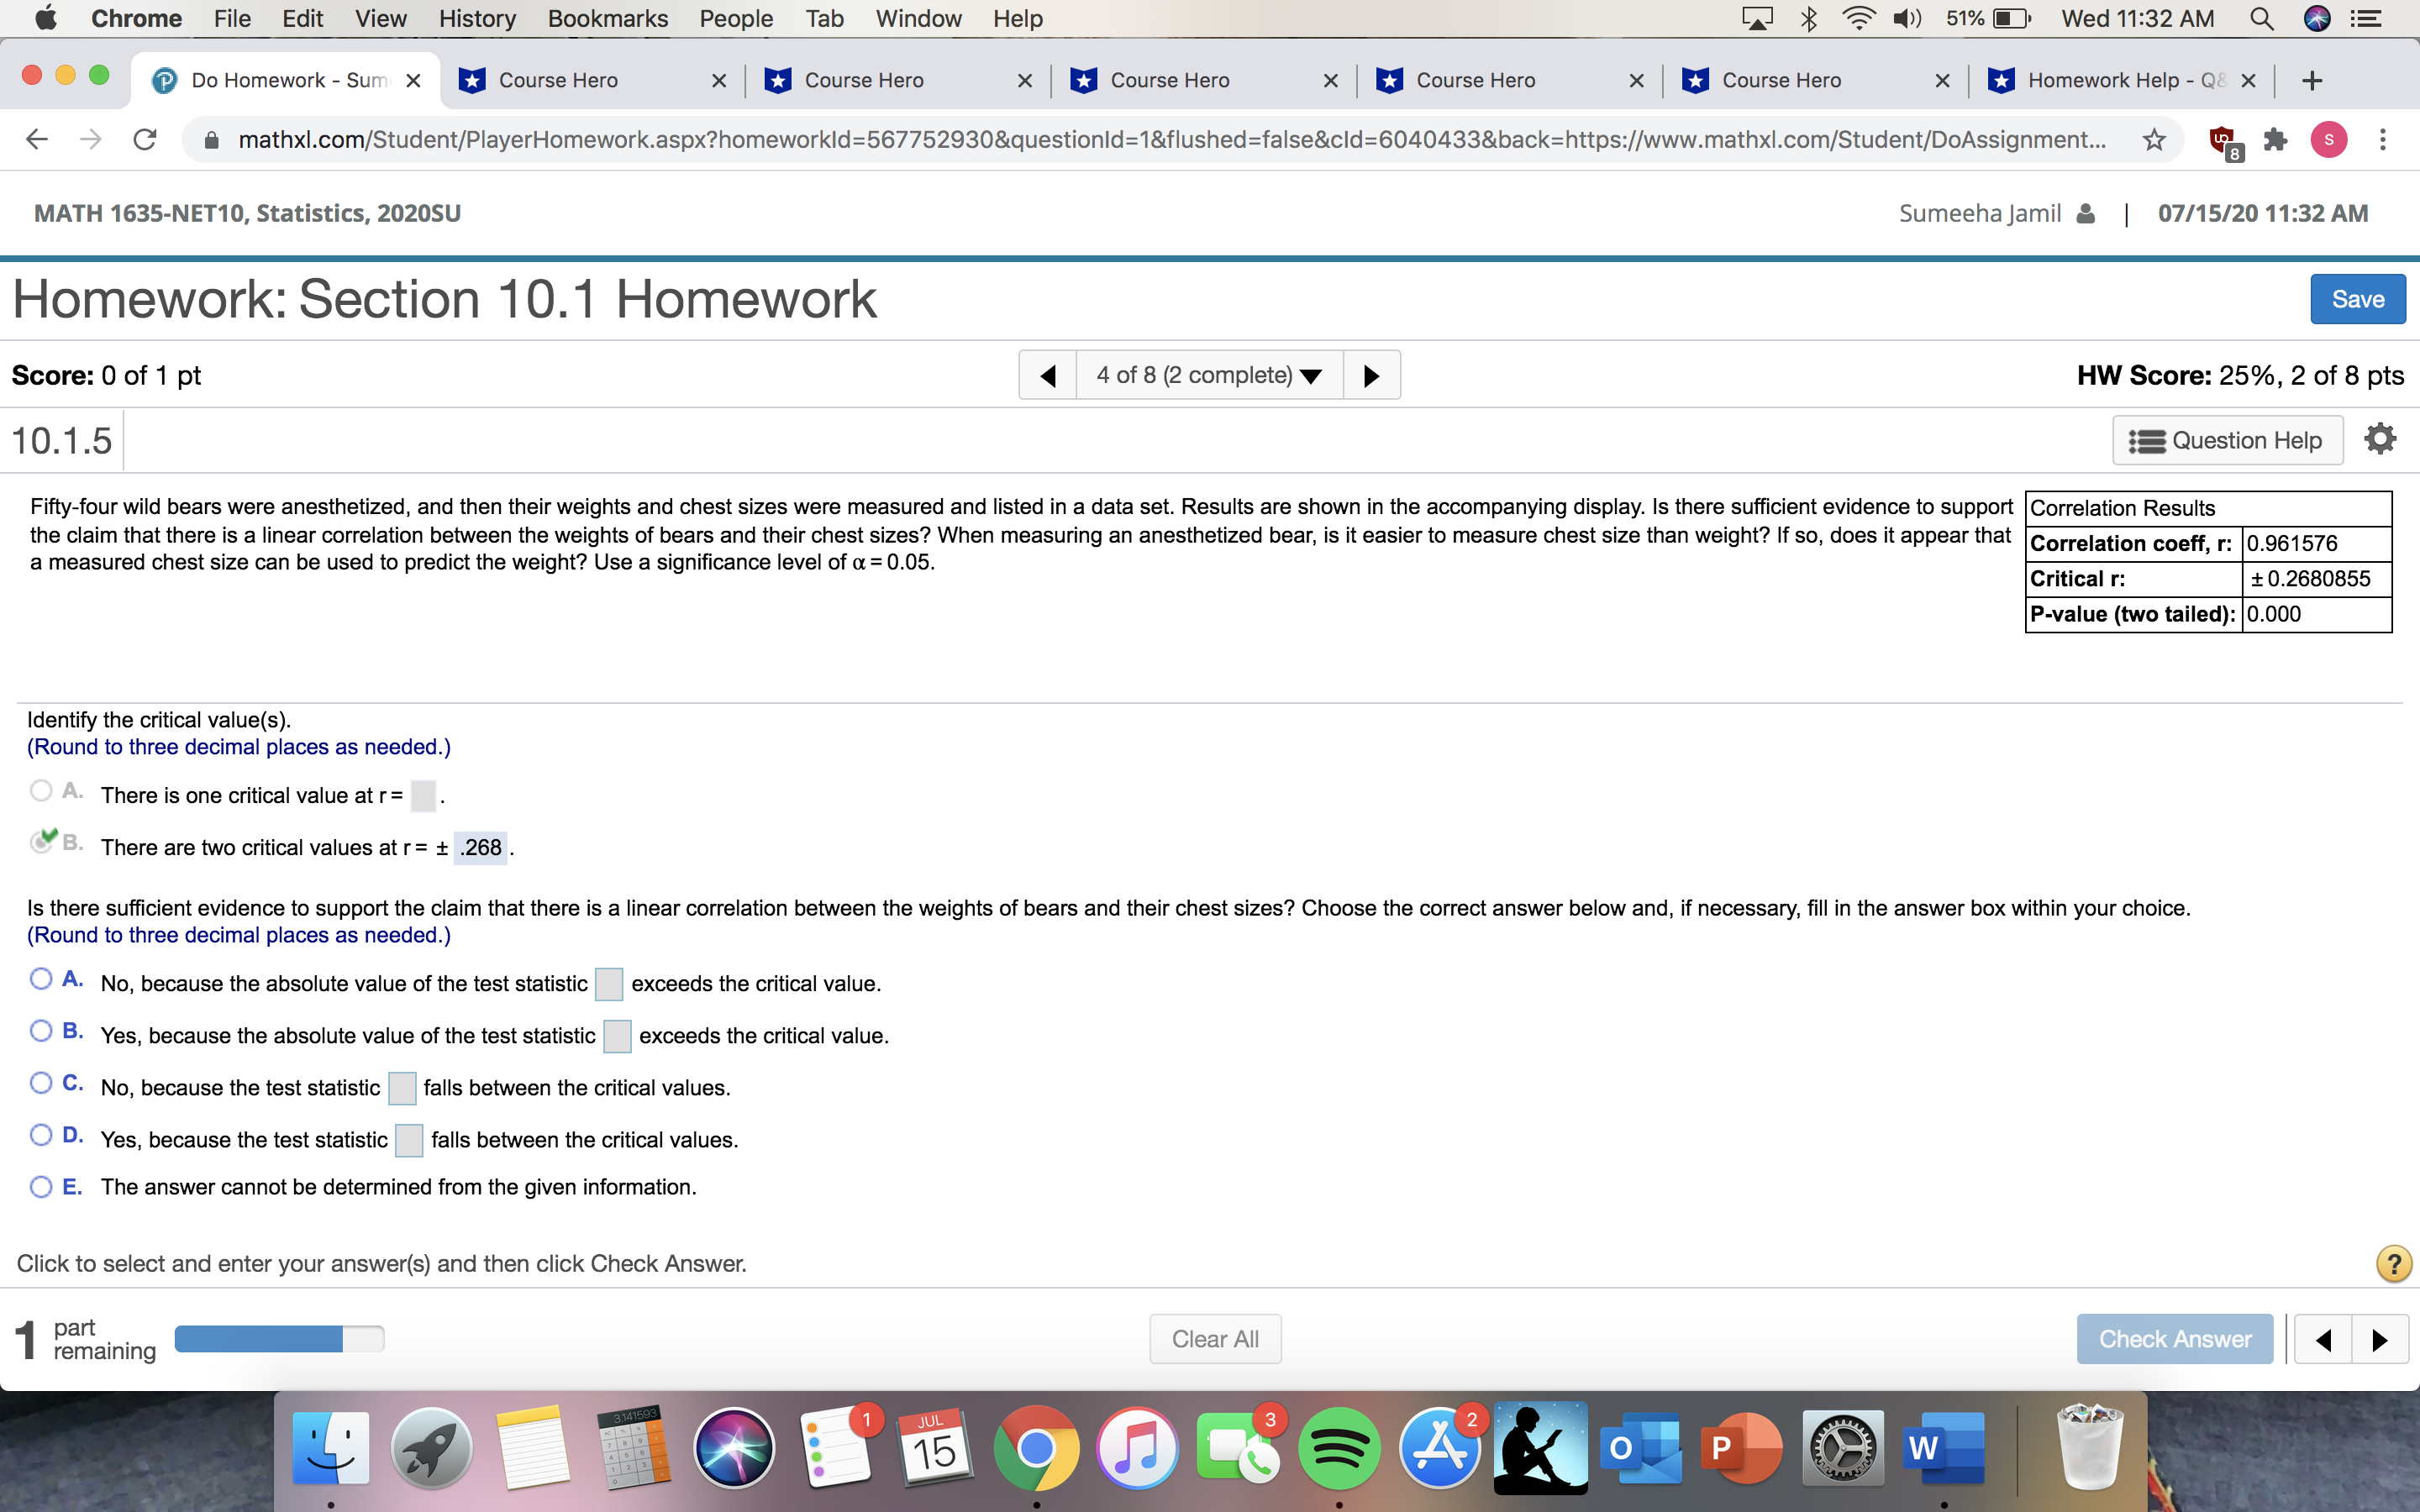
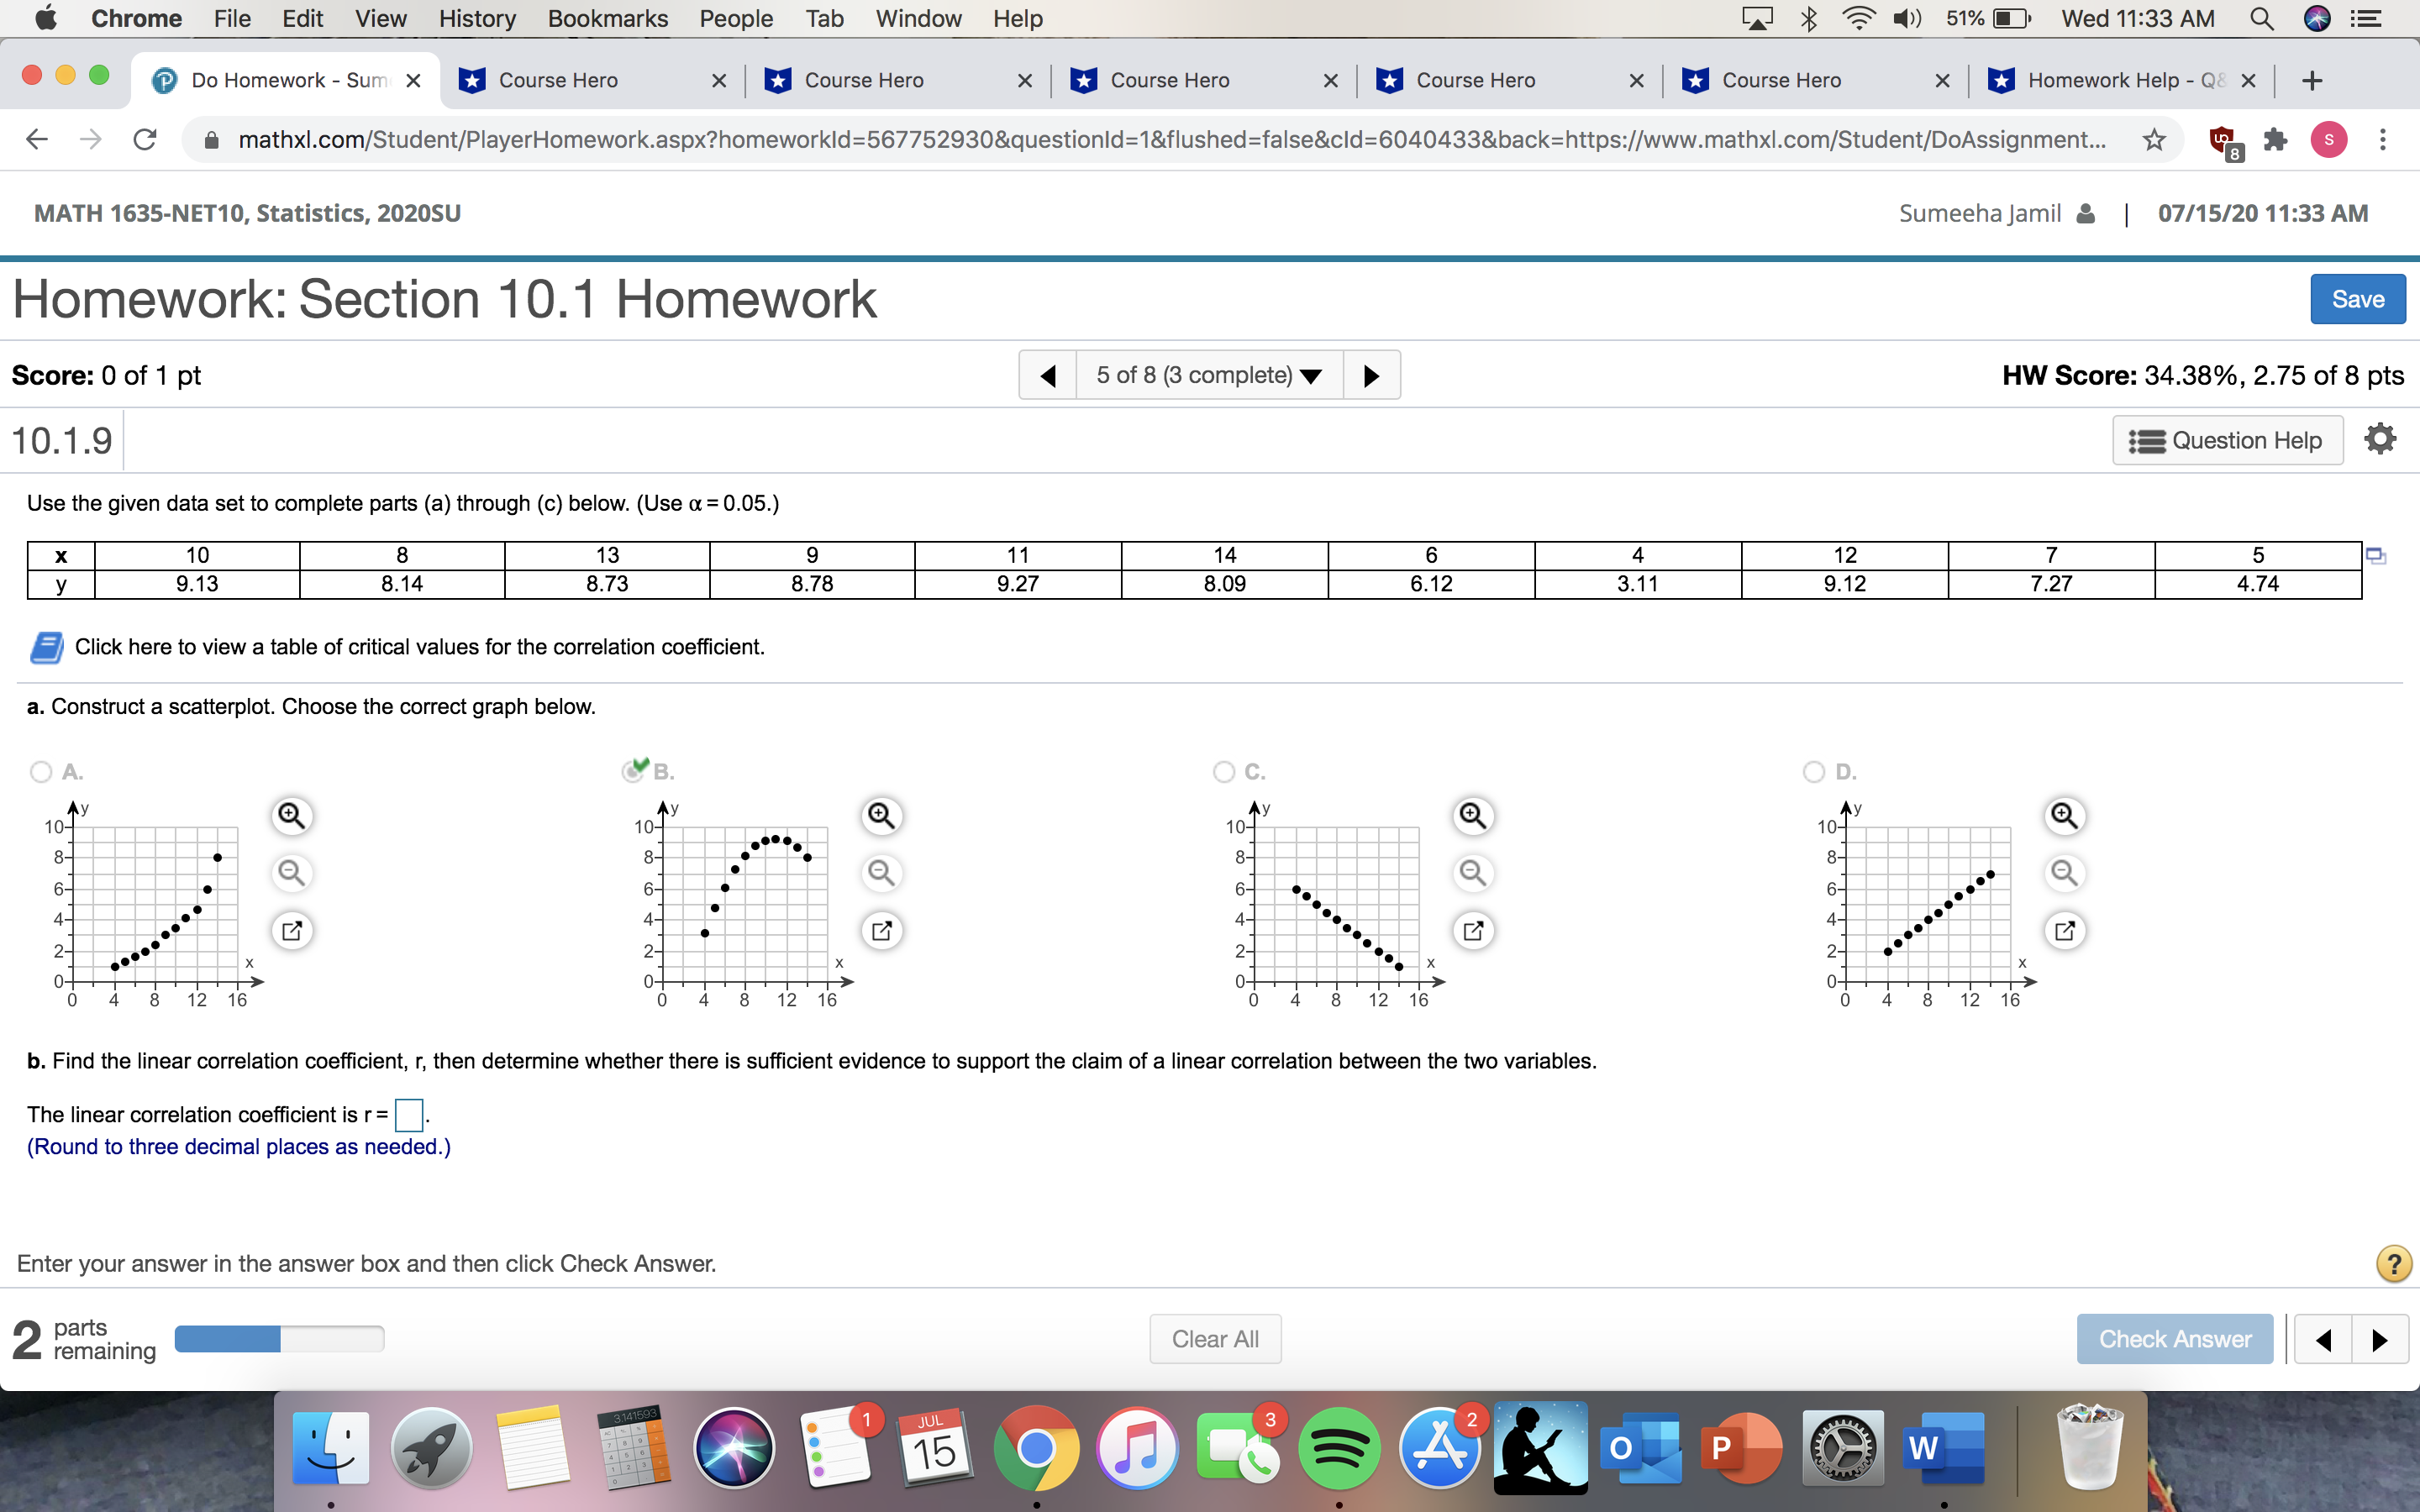
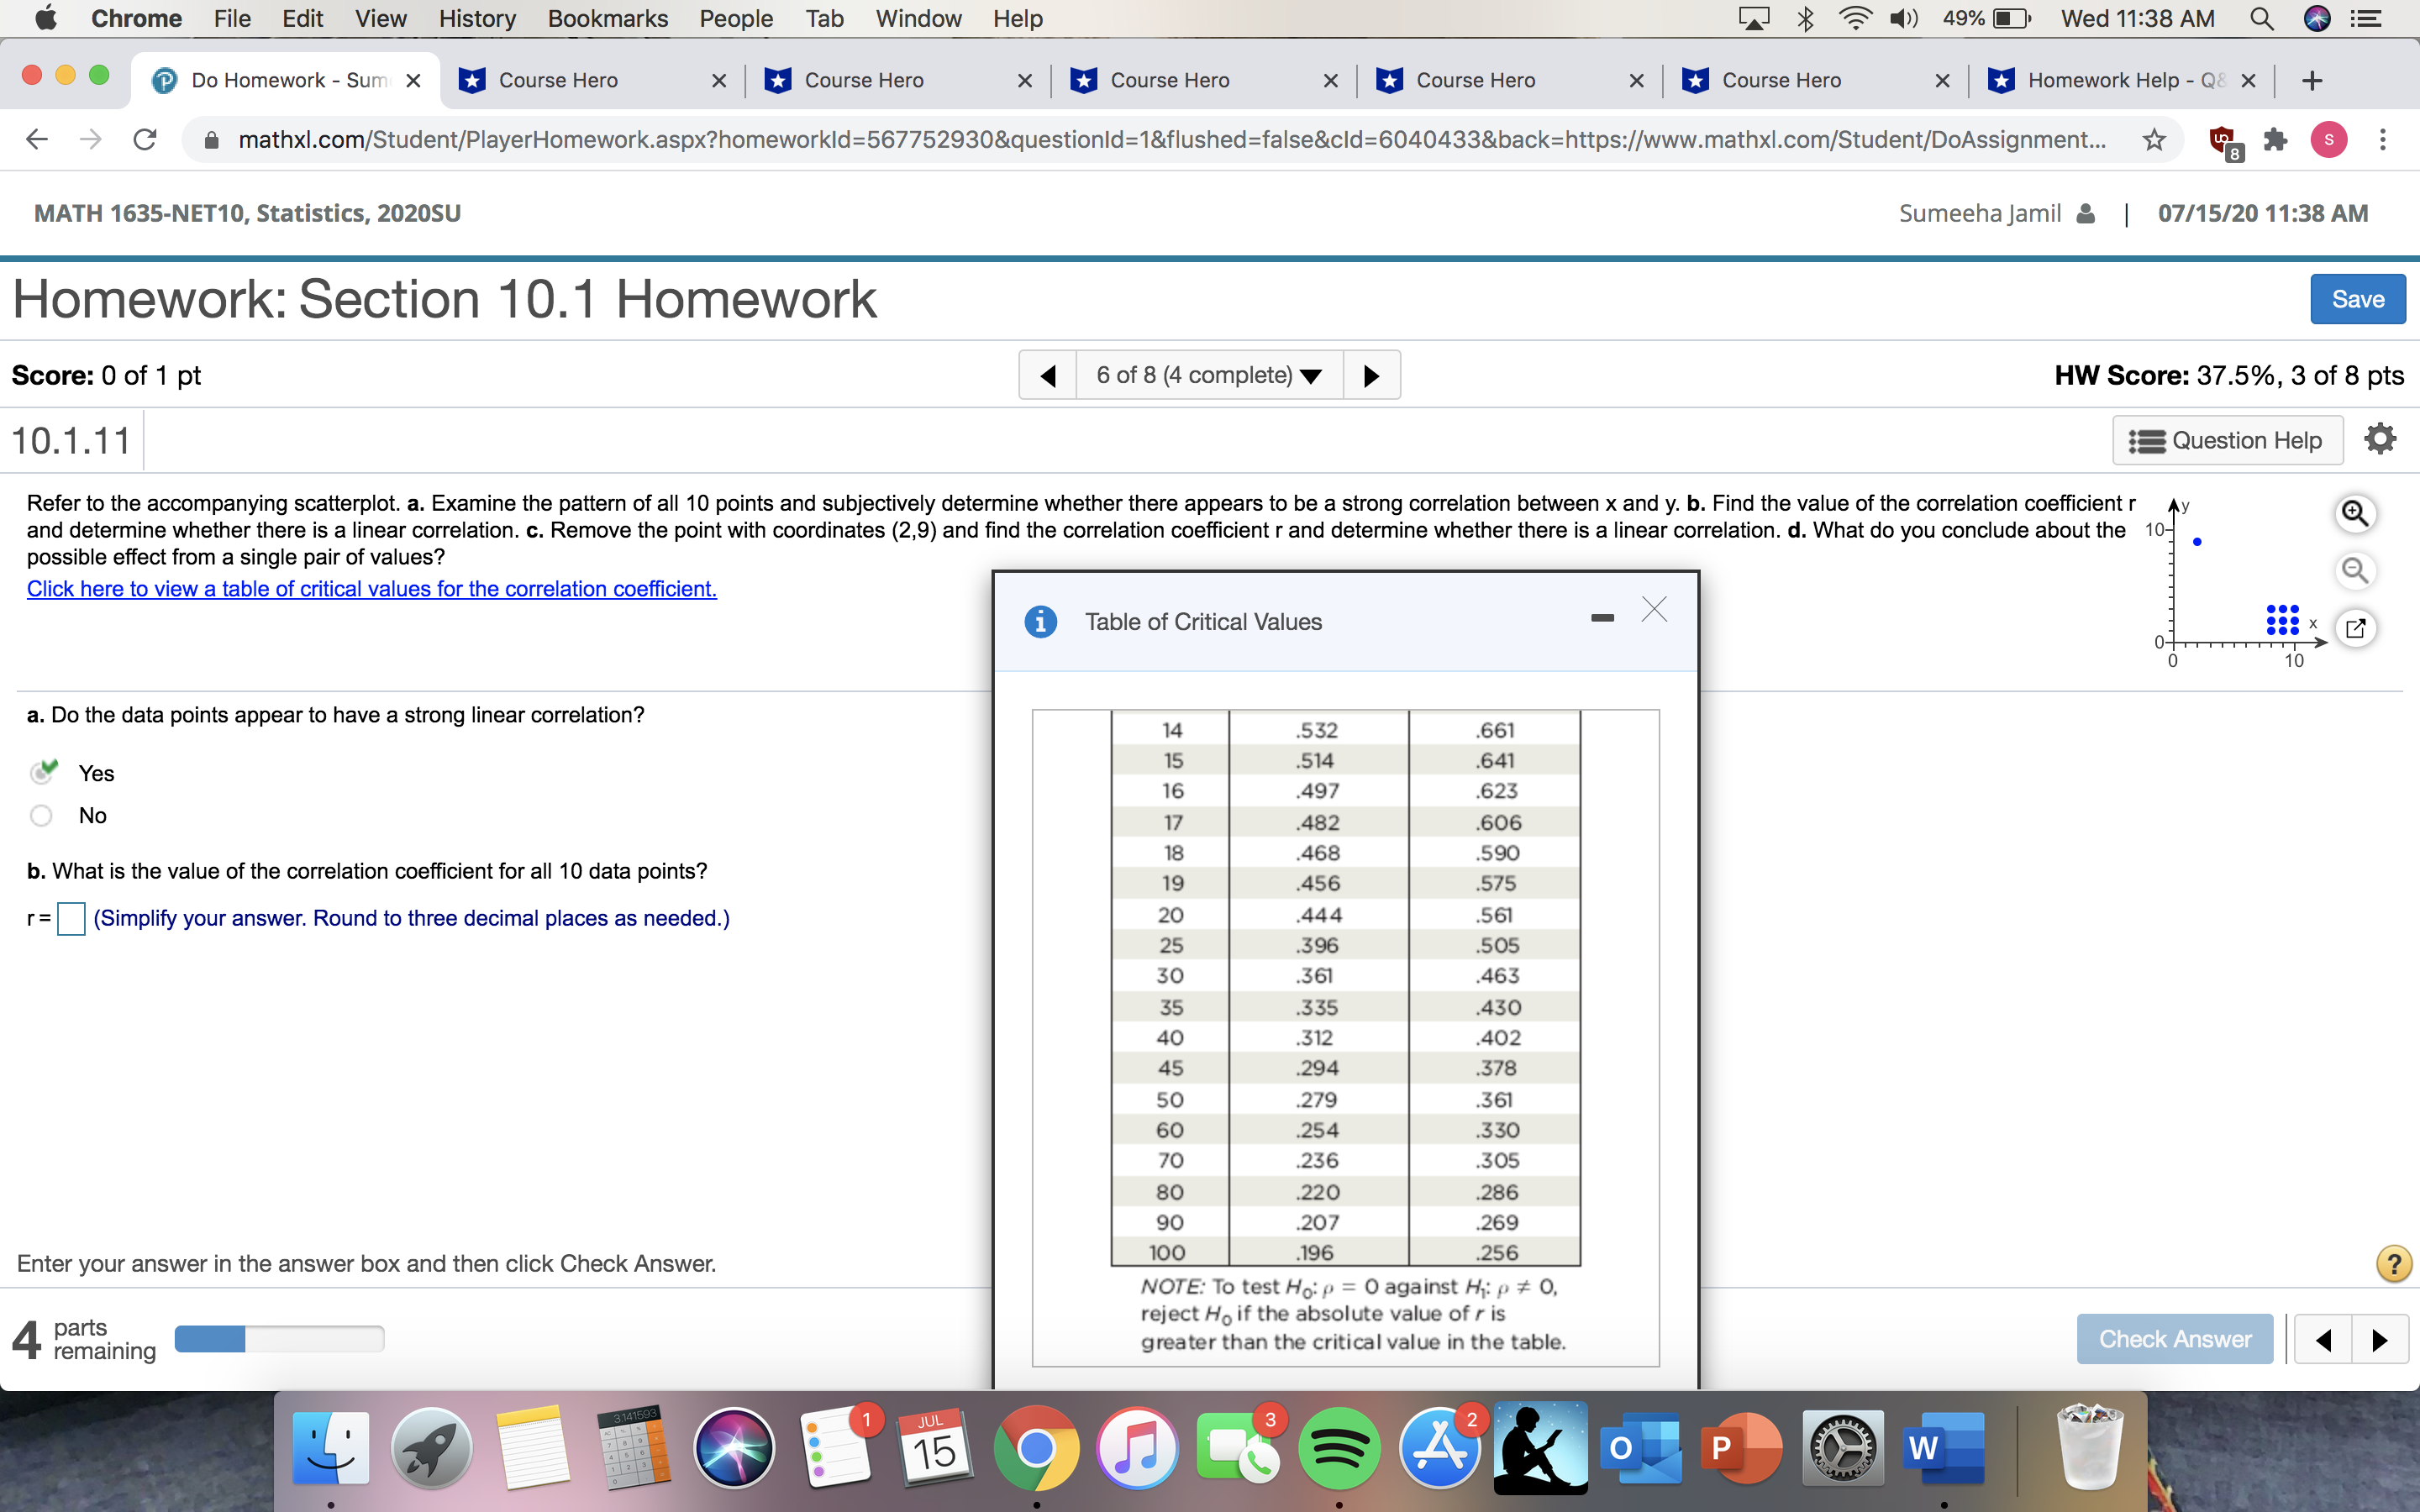
Chrome File Edit View History Bookmarks People Tab Window Help X ) 53% Wed 11:30 AM Q ... Do Homework - Sumeeha X Course Hero * *Course Hero x Course Hero x Course Hero x Course Hero X + C mathxl.com/Student/PlayerHomework.aspx?homeworkld=567752930&questionld=1&flushed=false&cld=6040433&back=https://www.mathxl.com/Student/DoAssignment... . .. MATH 1635-NET10, Statistics, 2020SU Sumeeha Jamil & | 07/15/20 11:30 AM Homework: Section 10.1 Homework Save Score: 0 of 1 pt 3 of 8 (2 complete) HW Score: 25%, 2 of 8 pts 10.1.4 Question Help Match these values of r with the accompanying scatterplots: - 1, - 0.681, 0.994, 1, and 0.32. Click the icon to view the scatterplots. Match the values of r to the scatterplots. Scatterplot 1, r= Scatterplot 2, r= Scatterplot 3, r= Scatterplot 4, r= Scatterplot 5, r= Click to select your answer(s) and then click Check Answer. ? All parts showing Clear All Check Answer JUL 15 O o P W0' Chrome File Edit View History Bookmarks People Tab Window Help L: )3 '5? It) 51% - wed 11:32AM Q Q r 1 0 . a Do HomeworkSun x u Course Hero x l u Course Hero x l u Course Hero x l u Course Hero x l u Course Hero x l u Homework Help-08 x l + 6 9 C h mathX|.ccm/Student/PlayerHomework.aspx?homeworkld=567752930&questionld=1&flushed=false&cld=6040433&back=httpszllwwwmathxl.com/Student/DoAssignment... it @EI * 5 MATH 1635-NET10, Statistics, 20205U Sumeeha Jamil A | 07/15/20 11:32 AM Homework: Section 10.1 Homework Score: 0 of 1 pt 4 4 of 8 (2 complete) v b HW Score: 25%, 2 of 8 pts 1 0.1.5 1 EEVCtuestion Help at Fifty-four wild bears were anesmetized, and then their weights and chest sizes were measured and listed in a data set, Results are shown in the accompanying display. Is there sufcient evidence to support Correlation Results the claim that there is a linear correlation between the weights of bears and their chest sizes? When measuring an anesthetized bear. is it easier to measure chest size than weight? If so, does it appear that Correlation coeff, r: 0.961576 a measured chest size can be used to predict the weight? Use a signicance level of u= 0.05. Critical r: 1: 0.2680855 P-value (two tailed): 0.000 Identify the critical value(s). (Round to three decimal places as needed.) A- There is one critical value at r= 'v 3- There are two critical values at r= 2 .268 . Is there sufcient evidence to support the claim that there is a linear correlation between the weights of bears and their chest sizes? Choose the correct answer below and. if necessary, ll in the answer box within your choice. (Round to three decimal places as needed.) O A- No, because the absolute value of the test statistic exceeds the critical value. O 3- Yes, because the absolute value of the test statistic exceeds the critical value. O C. No, because the test statistic falls between the critical values. O D- Yes, because the test statistic falls between the critical values. O E. The answer cannot be determined from the given information. Click to select and enter your answer(s) and then click Check Answer. Pa\" _ remaining Clear All Chrome File Edit View History Bookmarks People Tab Window Help X ) 51% Wed 11:33 AM QE ... Do Homework - Sum X Course Hero x Course Hero Course Hero * *Course Hero * *Course Hero *Homework Help - Q& x + C mathxl.com/Student/PlayerHomework.aspx?homeworkld=567752930&questionld=1&flushed=false&cld=6040433&back=https://www.mathxl.com/Student/DoAssignment... . .. MATH 1635-NET10, Statistics, 2020SU Sumeeha Jamil & | 07/15/20 11:33 AM Homework: Section 10.1 Homework Save Score: 0 of 1 pt 5 of 8 (3 complete) HW Score: 34.38%, 2.75 of 8 pts 10.1.9 Question Help Use the given data set to complete parts (a) through (c) below. (Use a = 0.05.) 10 8 13 9 11 14 6 4 12 5 9.13 8.14 8.73 8.78 9.27 8.09 6.12 3.11 9.12 7.27 4.74 Click here to view a table of critical values for the correlation coefficient. a. Construct a scatterplot. Choose the correct graph below. O A. &B. O C. O D. 10- 8- O of 12 of NAZI 8 12 16 3 12 16 b. Find the linear correlation coefficient, r, then determine whether there is sufficient evidence to support the claim of a linear correlation between the two variables. The linear correlation coefficient is r=]. (Round to three decimal places as needed.) Enter your answer in the answer box and then click Check Answer. ? 2 parts remaining Clear All Check Answer 1 JUL 15 O o P WChrome File Edit View History Bookmarks People Tab Window Help X ) 49% Wed 11:38 AM Q ... Do Homework - Sum X Course Hero x Course Hero Course Hero * *Course Hero * *Course Hero X *Homework Help - Q& x + C mathxl.com/Student/PlayerHomework.aspx?homeworkld=567752930&questionld=1&flushed=false&cld=6040433&back=https://www.mathxl.com/Student/DoAssignment... . .. MATH 1635-NET10, Statistics, 2020SU Sumeeha Jamil & | 07/15/20 11:38 AM Homework: Section 10.1 Homework Save Score: 0 of 1 pt 6 of 8 (4 complete) HW Score: 37.5%, 3 of 8 pts 10.1.11 Question Help Refer to the accompanying scatterplot. a. Examine the pattern of all 10 points and subjectively determine whether there appears to be a strong correlation between x and y. b. Find the value of the correlation coefficient r and determine whether there is a linear correlation. c. Remove the point with coordinates (2,9) and find the correlation coefficient r and determine whether there is a linear correlation. d. What do you conclude about the 10- Ay possible effect from a single pair of values? Click here to view a table of critical values for the correlation coefficient. i Table of Critical Values X 10 a. Do the data points appear to have a strong linear correlation? .950 .990 Yes .878 .959 No .811 .917 .754 875 b. What is the value of the correlation coefficient for all 10 data points? 707 834 r=(Simplify your answer. Round to three decimal places as needed.) 666 .798 632 .765 602 735 .576 .708 .553 .684 .532 .661 .514 .641 497 .623 482 606 468 .590 456 .575 20 444 .561 Enter your answer in the answer box and then click Check Answer. 25 396 .505 ? 30 .361 .463 4 parts 35 335 430 remaining Check Answer JUL 15 3 O P EO WChrome File Edit View History Bookmarks People Tab Window Help X ) 49% Wed 11:38 AM Q ... Do Homework - Sum X Course Hero x Course Hero Course Hero * *Course Hero * *Course Hero X *Homework Help - Q& x + C mathxl.com/Student/PlayerHomework.aspx?homeworkld=567752930&questionld=1&flushed=false&cld=6040433&back=https://www.mathxl.com/Student/DoAssignment... . .. MATH 1635-NET10, Statistics, 2020SU Sumeeha Jamil & | 07/15/20 11:38 AM Homework: Section 10.1 Homework Save Score: 0 of 1 pt 6 of 8 (4 complete) HW Score: 37.5%, 3 of 8 pts 10.1.11 Question Help Refer to the accompanying scatterplot. a. Examine the pattern of all 10 points and subjectively determine whether there appears to be a strong correlation between x and y. b. Find the value of the correlation coefficient r Ay and determine whether there is a linear correlation. c. Remove the point with coordinates (2,9) and find the correlation coefficient r and determine whether there is a linear correlation. d. What do you conclude about the 10- possible effect from a single pair of values? Click here to view a table of critical values for the correlation coefficient. i Table of Critical Values X 10 a. Do the data points appear to have a strong linear correlation? 14 .532 661 15 .514 .641 Yes 16 497 .623 No 17 482 606 18 468 .590 b. What is the value of the correlation coefficient for all 10 data points? 19 456 .575 r=(Simplify your answer. Round to three decimal places as needed.) 20 444 .561 25 .396 .505 30 .361 .463 35 335 .430 40 .312 .402 45 .294 .378 50 .279 .361 60 .254 .330 70 .236 .305 80 .220 .286 90 207 .269 Enter your answer in the answer box and then click Check Answer. 100 .196 .256 ? NOTE: To test Ho: p = 0 against Hip # 0, reject Ho if the absolute value of r is 4 parts greater than the critical value in the table. Check Answer remaining JUL 15 3 E AS O P WChrome File Edit View History Bookmarks People Tab Window Help X ) 48% Wed 11:39 AM QE ... Do Homework - Sum X Course Hero x Course Hero Course Hero * *Course Hero * *Course Hero X Homework Help - Q& x + C mathxl.com/Student/PlayerHomework.aspx?homeworkld=567752930&questionld=1&flushed=false&cld=6040433&back=https://www.mathxl.com/Student/DoAssignment... * . .. MATH 1635-NET10, Statistics, 2020SU Sumeeha Jamil & | 07/15/20 11:39 AM Homework: Section 10.1 Homework Save Score: 0 of 1 pt 7 of 8 (5 complete) HW Score: 39.58%, 3.17 of 8 pts 10.1.21-T Question Help The accompanying table lists the ages of acting award winners matched by the years in which the awards were won. Construct a scatterplot, find the value of the linear correlation coefficient r, and find the P-value of r. Determine whether there is sufficient evidence to support a claim of linear correlation between the two variables. Should we expect that there would be a correlation? Use a significance level of a = 0.01. Click the icon to view the ages of the award winners. Construct a scatterplot. Choose the correct graph below. O A. B. O c. O D. Best Actor (years) Best Actor (years) 707 707 20- Best Actor (years) 20 Best Actor (years) O-+ 20 20 20 20 7 Best Actress (years) Best Actress (years) Best Actress (years) Best Actress (years) The linear correlation coefficient r is. (Round to three decimal places as needed.) i Best Actresses and Best Actors X Best Actress 29 30 29 61 31 32 47 29 64 21 45 57 Best Actor 43 39 39 44 51 46 62 51 41 52 44 33 Print Done Enter your answer in the answer box and then click Check Answer. ? 5 parts remaining Clear All Check Answer 1 JUL 15 O P EO W