Chrome File Edit View History Bookmarks Profiles Tab Window Help O ~ Q 8. @ Fri Dec 2 8:48 PM ... P Final Exam (HW
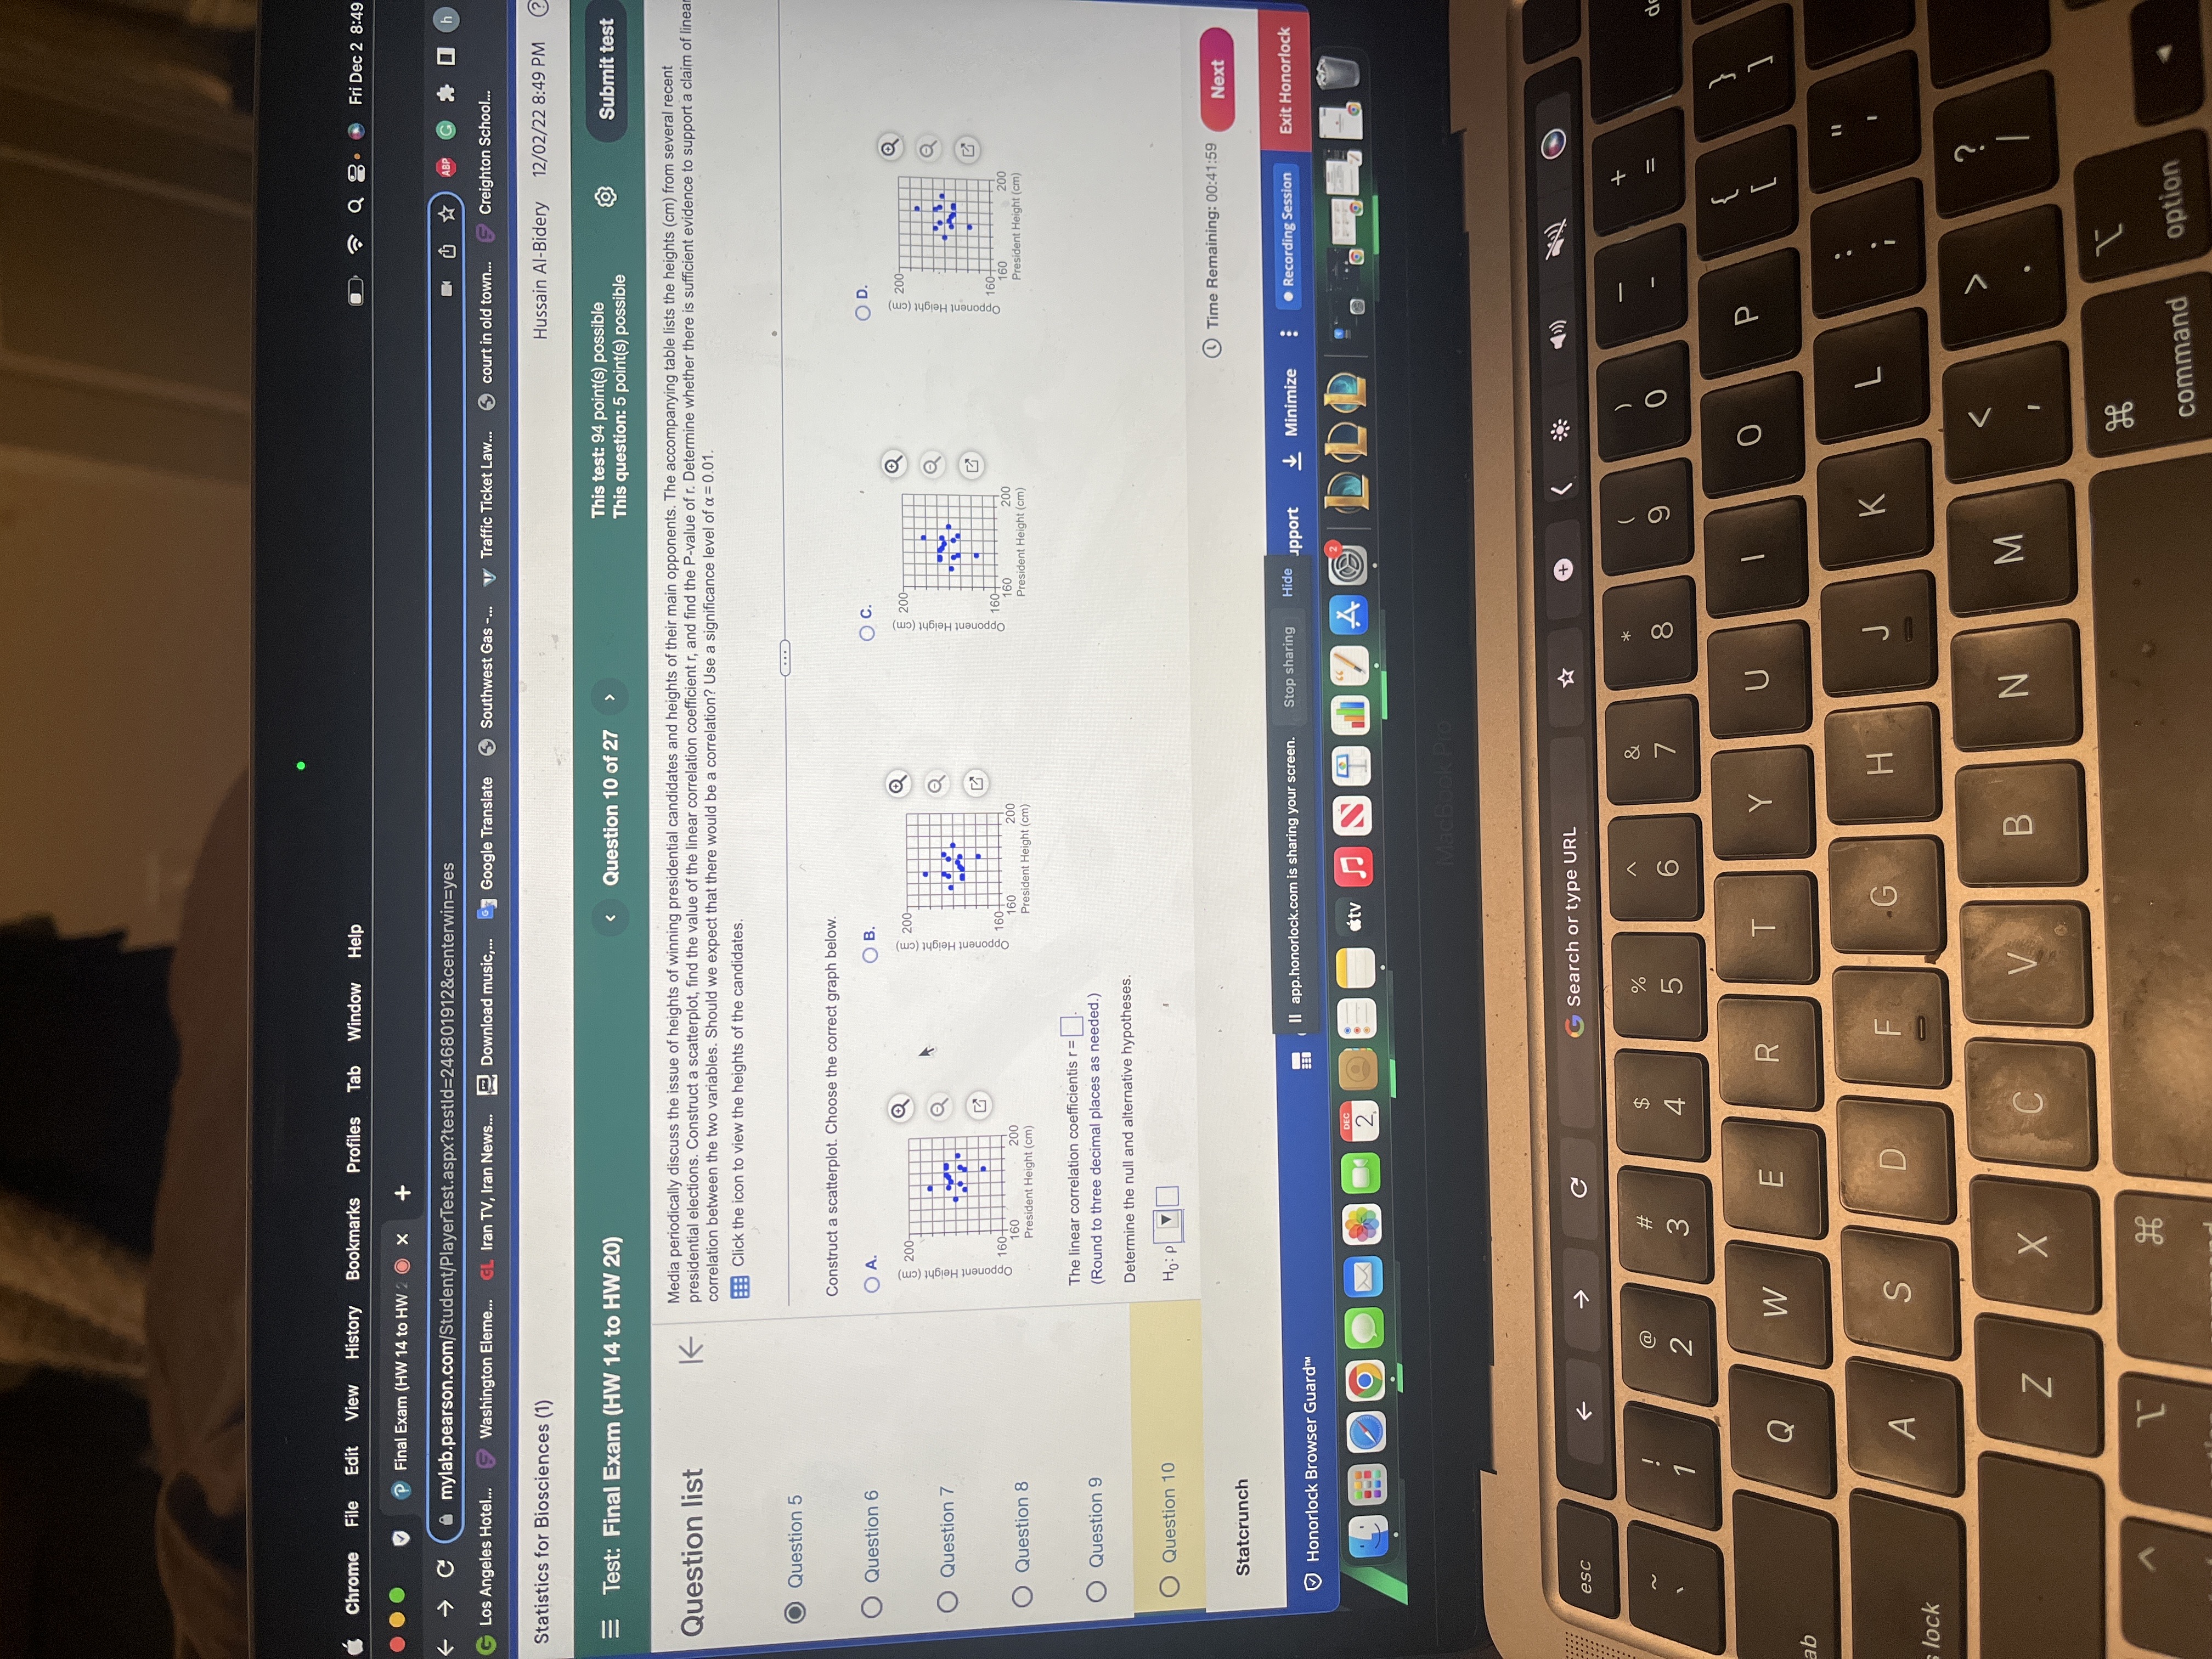
Chrome File Edit View History Bookmarks Profiles Tab Window Help O ~ Q 8. @ Fri Dec 2 8:48 PM ... P Final Exam (HW 14 to HW 2 0 x @ mylab.pearson.com/Student/PlayerTest.aspx?testld=246801912¢erwin=yes G Los Angeles Hotel... Washington Elemen. GL Iran TV, Iran News.. Download music,. Google Translate Southwest Gas -. V Traffic Ticket Law. court in old town. Creighton School. Statistics for Biosciences (1) Hussain Al-Bidery 12/02/22 8:48 PM @ = Test: Final Exam (HW 14 to HW 20) Question 17 of 27 This test: 94 point(s) possible This question: 5 point(s) possible Submit test Question list The data show systolic and diastolic blood pressure of cendiastolic f.certain people. Find the regression equation, letting the systolic reading be the independent (x) variable. If one of these people has a systolic blood pressure of 148 mm Hg, what is the best predicted diastolic blood pressure? Systolic 139 Question 14 Diastolic 102 113 150 129 112 128 139 80 74 Click the icon to view the critical values of the Pearson correlation coefficient r. Question 15 What is the regression equation? Question 16. y= +x (Round to two decimal places as needed.) What is the best predicted diastolic blood pressure? Question 17 y =(Round to one decimal place as needed.) Question 18 Question 19 nination on Time Remaining: 00:42:34 Next Statcrunch Honorlock Browser Guard all app.honorlock.com is sharing your screen. Stop sharing Hide upport & Minimize . Recording Session Exit Honorlock esc G Search or type URL + A LA OO W # delete - .- R Y U O P W tab S D G H J K L A ret caps lock Z X C B N M shift 96 fn command option control option command F85350Chrome File Edit View History Bookmarks Profiles Tab Window Help O ~ Q g. Fri Dec 2 8:49 .. . P Final Exam (HW 14 to HW 2 0 x -> C ( mylab.pearson.com/Student/PlayerTest.aspx?testld=246801912¢erwin=yes G Los Angeles Hotel... Washington Element Iran TV, Iran News. _Download music,.. Google Translate Southwest Gas -... V Traffic Ticket Law. court in old town. Creighton School. Statistics for Biosciences (1) Hussain Al-Bidery 12/02/22 8:49 PM Test: Final Exam (HW 14 to HW 20) Question 10 of 27 This test: 94 point(s) possible This question: 5 point(s) possible Submit test Media periodically discuss the issue of heights of winning presidential candidates and heights of their main opponents. The accompanying table lists the heights (cm) from several recent Question list K presidential elections. Construct a scatterplot, find the value of the linear correlation coefficient r, and find the P-value of r. Determine whether there is sufficient evidence to support a claim of linea correlation between the two variables. Should we expect that there would be a correlation? Use a significance level of a = 0.01. Click the icon to view the heights of the candidates Question 5 Construct a scatterplot. Choose the correct graph below. O Question 6 O A OB DC. OD. 200 5 200 Question 7 Opponent Height (cm) opponent hergo Opponent Height HIP 160 160 200 200 200 Question 8 President Height (cm) President Height (cm President Height (cm) President Height (cm) The linear correlation coefficientis r= Question 9 (Round to three decimal places as needed.) Determine the null and alternative hypotheses. Question 10 Ho: P VO Time Remaining: 00:41:59 Next Statcrunch Honorlock Browser Guard all app.honorlock.com is sharing your screen. Stop sharing Hide upport Minimize : . Recording Session Exit Honorlock 2 . + 41)) O esc C G Search or type URL W # 2 9 O N O P Q W E R T Y . . K D H J A S G lock Z X C B N M T command optionChrome Edit View History Bookmarks Profiles Tab Window Help 1 7 9 8. 0 Final Exam (HW 14 to HW 2 0 x mylab.pearson.com/Student/PlayerTest.aspx?testld=246801912¢erwin=yes G Los Angeles Hotel... Washington Elemeliran TV, Iran News... Download music,... Google Translate Southwest Gas -... V Traffic Ticket Law... court in old town. Creighton Scho Statistics for Biosciences (1) Hussain Al-Bidery 12/02/2 Test: Final Exam (HW 14 to HW 20) Question 10 of 27 > This test: 94 point(s) possible This question: 5 point(s) possible Question list K Media periodically discuss the issue of heights of winning presidential candidates and heights of their main opponents. The accompanying table lists the heights (cm) from several presidential elections. Construct a scatterplot, find the value of the linear correlation coefficient r, and find the P-value of r. Determine whether there is sufficient evidence to support correlation between the two variables. Should we expect that there would be a correlation? Use a significance level of a = 0.01. Click the icon to view the heights of the candidates. Question 5 X Co Candidate Heights Question 6 O D. President 183 184 192 179 174 181 187 179 178 180 188 186 186 187 Opponent 177 176 181 169 180 178 182 177 184 182 176 192 184 176 Question 7 Opponent Height (cm) Opponent Height (c HIIIIIII Question 8 Print Done 160 200 President Height (cm) The Question 9 (Round to three decimal places as needed.) Determine the null and alternative hypotheses. Question 10 Ho : P V Time Remaining: 00:41:48 Statcrunch Honorlock Browser Guard Ell app.honorlock.com is sharing your screen. Stop sharing Hide upport & Minimize . Recording Session Exit 2 + esc G Search or type URL @ W # 5 6 9 O N W E Y O P Q R ab A S G H J K s lock Z X C B N M T command optionChrome File Edit View History Bookmarks Profiles Tab Window Help . ~ Q g. Fri Dec 2 8:49 PM ... P Final Exam (HW 14 to HW 2 0 x C ( mylab.pearson.com/Student/PlayerTest.aspx?testld=246801912¢erwin=yes G Los Angeles Hotel... Washington Eleme GL Iran TV, Iran News... Download music,. Google Translate Southwest Gas -.. V Traffic Ticket Law. court in old town. Creighton School. Statistics for Biosciences (1) Hussain Al-Bidery 12/02/22 8:49 PM Test: Final Exam (HW 14 to HW 20) This test: 94 point(s) possible This question: 5 point(s) possible Submit test Question list K Media periodically discuss the issue of heights of winning presidential candidates and heights of their main opponents. The accompanying table lists the heights (cm) from several recent presidential elections. Construct a scatterplot, fin discuss the scatterplot find the value of the linear correlation coefficient r, and find the P-value of r. Determine whether there is sufficient evidence to support a claim of linear correlation between the two variables. Should we expect that there would be a correlation? Use a significance level of a = 0.01. Click the icon to view the heights of the candidates. O Question 5 (Type integers or decimals. Do not round.) Question 6 The test statistic is t =. (Round to two decimal places as needed.) The P-value is Question 7 (Round to three decimal places as needed.) Because the P-value of the linear correlation coefficient is the significance level, there sufficient evidence to support the claim that there is a linear correlation Question 8 between the heights of winning presidential candiates and the heights of their opponents. Should we expect that there would be a correlation? Question 9 O A. Yes, because presic or reasons other than height. O B. No, becau residential s are nominated for reasons other than height. O C. Yes, because al candidates are nominated. Question 10 O D. No, because height is the main reason presidential candidates are nominated. Time Remaining: 00:41:34 Next Statcrunch & Minimize . Recording Session Exit Honorlock Honorlock Browser II app.honorlock.com is sharing your screen. Stop sharing Hide upport G Search or type URL + esc C C J .- W# 6 delete O P W E R T Y Q tab . . . G H J K A S D caps lock K . 1 B N M Z X C nift T 96 command option control option command F86350
Step by Step Solution
There are 3 Steps involved in it
Step: 1
Get Instant Access to Expert-Tailored Solutions
See step-by-step solutions with expert insights and AI powered tools for academic success
Step: 2
Step: 3
Ace Your Homework with AI
Get the answers you need in no time with our AI-driven, step-by-step assistance