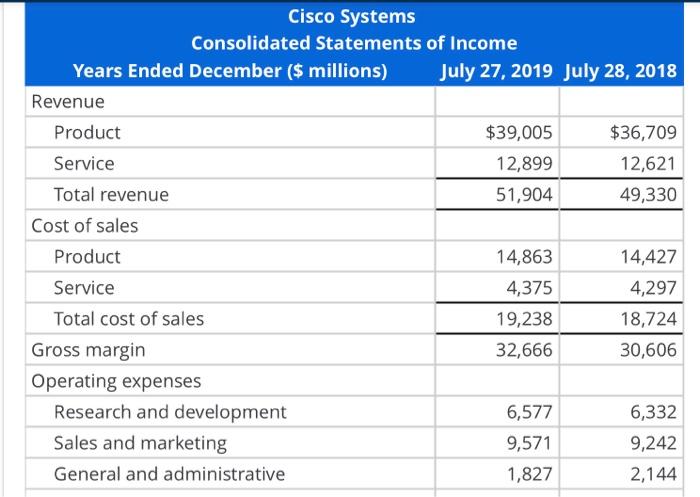
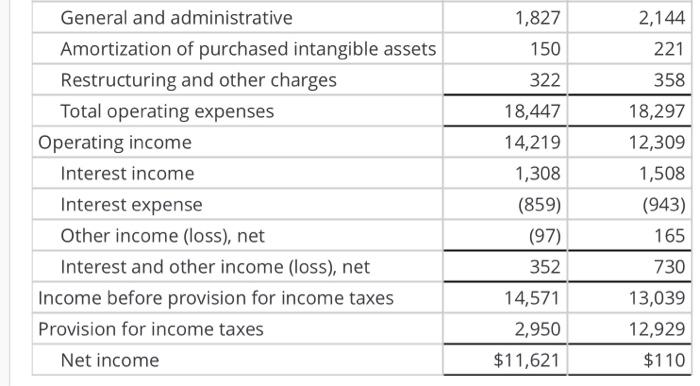
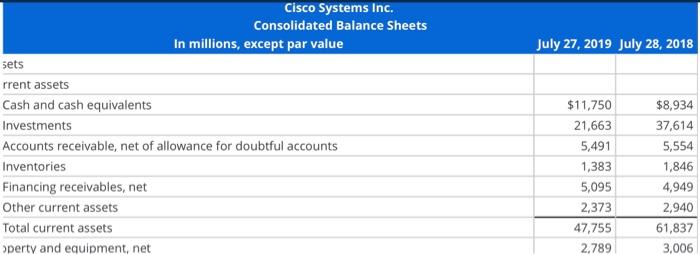
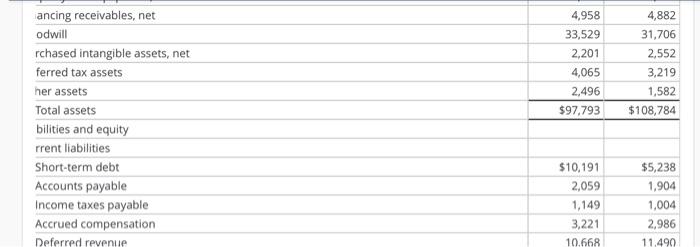
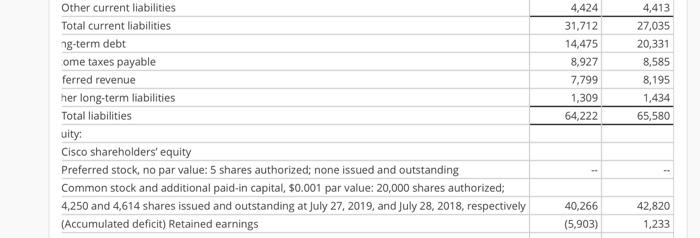
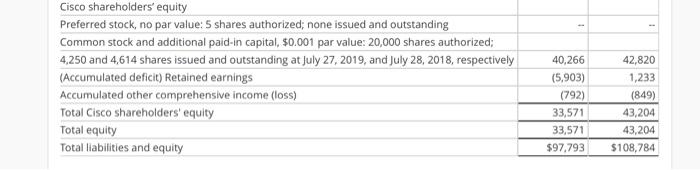
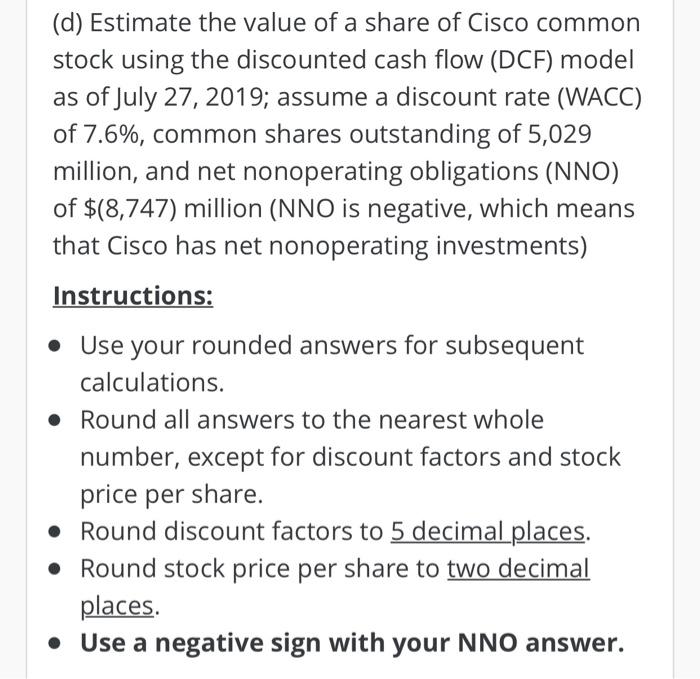
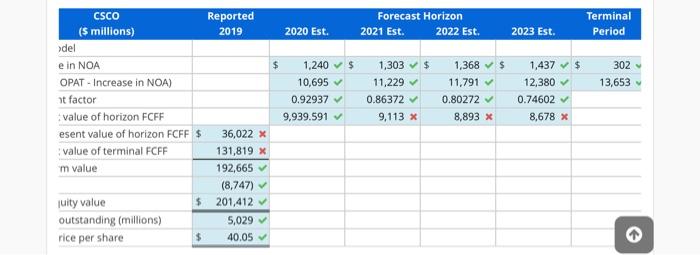
Cisco Systems Consolidated Statements of Income Years Ended December ($ millions) July 27, 2019 July 28, 2018 Revenue Product $39,005 $36,709 Service 12,899 12,621 Total revenue 51,904 49,330 Cost of sales Product 14,863 14,427 Service 4,375 4,297 Total cost of sales 19,238 18,724 Gross margin 32,666 30,606 Operating expenses Research and development 6,577 6,332 Sales and marketing 9,571 9,242 General and administrative 1,827 2,144 2,144 221 358 General and administrative Amortization of purchased intangible assets Restructuring and other charges Total operating expenses Operating income Interest income Interest expense Other income (loss), net Interest and other income (loss), net Income before provision for income taxes Provision for income taxes Net income 1,827 150 322 18,447 14,219 1,308 (859) (97) 352 18,297 12,309 1,508 (943) 165 730 14,571 2,950 $11,621 13,039 12,929 $110 July 27, 2019 July 28, 2018 Cisco Systems Inc. Consolidated Balance Sheets In millions, except par value sets rrent assets Cash and cash equivalents Investments Accounts receivable, net of allowance for doubtful accounts Inventories Financing receivables, net Other current assets Total current assets perty and equipment, net $11.750 21,663 5,491 1,383 5,095 2,373 47,755 2,789 $8,934 37,614 5,554 1,846 4,949 2,940 61,837 3,006 4,958 33,529 2,201 4,065 2,496 $97.793 4,882 31,706 2,552 3,219 1,582 $108,784 ancing receivables, net odwill rchased intangible assets, net ferred tax assets her assets Total assets bilities and equity rrent liabilities Short-term debt Accounts payable Income taxes payable Accrued compensation Deferred revenue $10,191 2,059 1,149 3,221 10.668 $5,238 1,904 1,004 2,986 11.490 Other current liabilities Total current liabilities ng-term debt ome taxes payable ferred revenue her long-term liabilities Total liabilities uity: Cisco shareholders' equity Preferred stock, no par value: 5 shares authorized: none issued and outstanding Common stock and additional paid-in capital, 50.001 par value: 20,000 shares authorized; 4,250 and 4,614 shares issued and outstanding at July 27, 2019, and July 28, 2018, respectively (Accumulated deficit) Retained earnings 4,424 31,712 14,475 8,927 7,799 1,309 64,222 4,413 27,035 20,331 8,585 8,195 1,434 65,580 40,266 (5,903) 42,820 1,233 Cisco shareholders' equity Preferred stock, no par value: 5 shares authorized: none issued and outstanding Common stock and additional paid-in capital, $0.001 par value: 20,000 shares authorized: 4,250 and 4,614 shares issued and outstanding at July 27, 2019, and July 28, 2018, respectively (Accumulated deficit) Retained earnings Accumulated other comprehensive income (loss) Total Cisco shareholders' equity Total equity Total liabilities and equity 42,820 1,233 (849) 40,266 (5,903) (792) 33,571 33,571 $97.793 43,204 43,204 $108,784 (d) Estimate the value of a share of Cisco common stock using the discounted cash flow (DCF) model as of July 27, 2019; assume a discount rate (WACC) of 7.6%, common shares outstanding of 5,029 million, and net nonoperating obligations (NNO) of $(8,747) million (NNO is negative, which means that Cisco has net nonoperating investments) Instructions: Use your rounded answers for subsequent calculations. Round all answers to the nearest whole number, except for discount factors and stock price per share. Round discount factors to 5 decimal places. Round stock price per share to two decimal places. Use a negative sign with your NNO answer. Forecast Horizon 2021 Est. 2022 Est. Terminal Period 2019 2020 Est. 2023 Est. 302 $ 1,240 $ 10,695 0.92937 9,939.591 1,303 $ 11,229 0.86372 1,368 $ 11.791 0.80272 8,893 x 1,437 12,380 0.74602 8,678 x 13,653 9,113 x CSCO Reported (5 millions) del e in NOA OPAT - Increase in NOA) at factor value of horizon FCFF esent value of horizon FCFF $ 36,022 X value of terminal FCFF 131,819 X m value 192,665 (8,747) juity value $ 201,412 outstanding (millions) 5,029 rice per share $ 40.05