

Answered step by step
Verified Expert Solution
Question
1 Approved Answer
class midpoints, rela following table. frequencies, is ca ing frequen cumulative frequencies a Cum Frequency Class Midpoint Relative Interval Frequency 6.40 6.30-ur ter 6.50
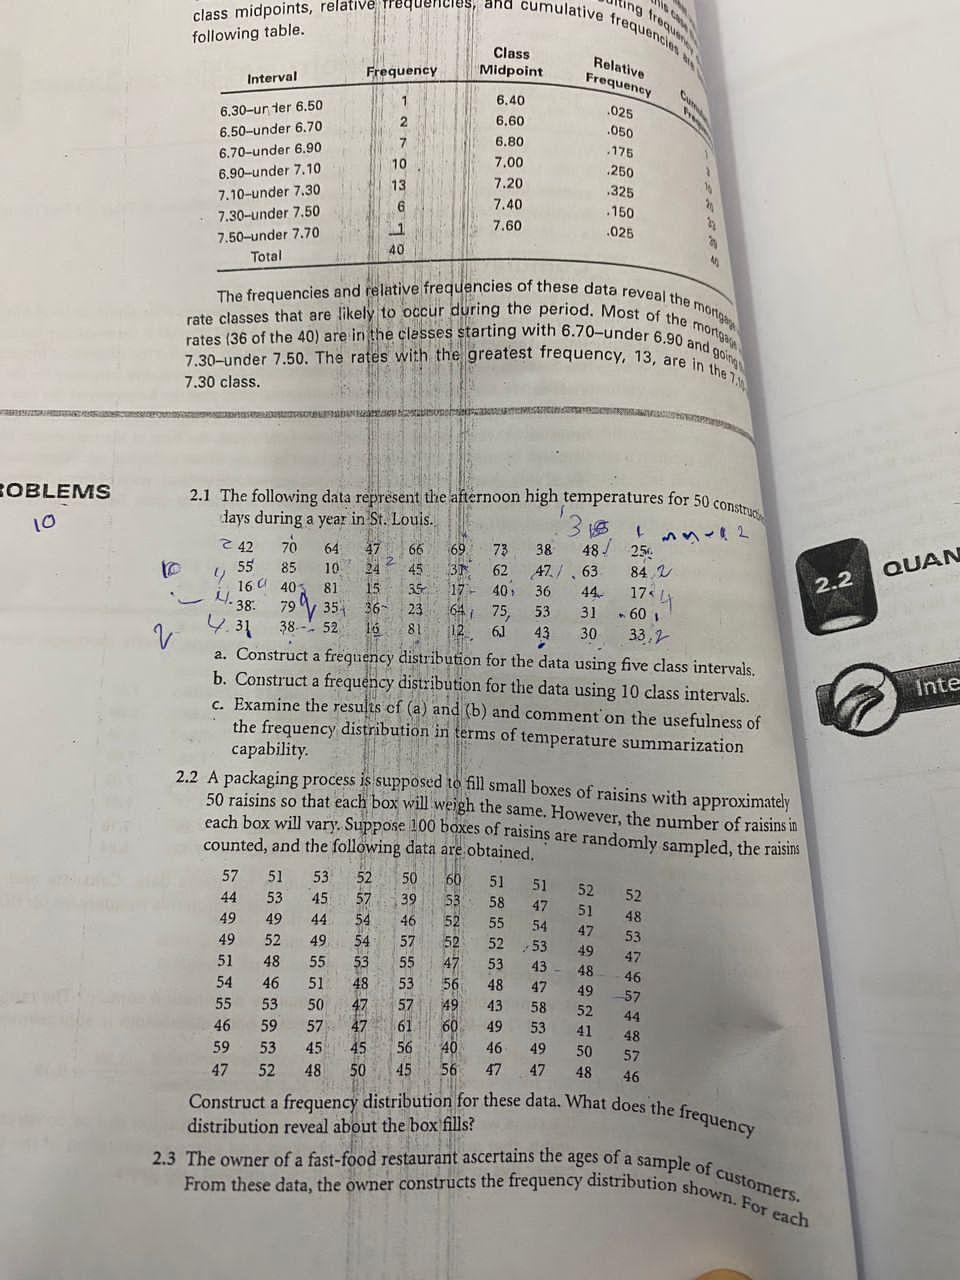
class midpoints, rela following table. frequencies, is ca ing frequen cumulative frequencies a Cum Frequency Class Midpoint Relative Interval Frequency 6.40 6.30-ur ter 6.50 .025 2 6.60 6.50-under 6.70 .050 6.80 6.70-under 6.90 .175 7.00 10 6.90-under 7.10 .250 13 7.20 7.10-under 7.30 .325 7.30-under 7.50 6 7.40 .150 7.60 .025 7.50-under 7.70 40 Total COBLEMS 10 mortga The frequencies and relative frequencies of these data reveal the mortg rate classes that are likely to occur during the period. Most of the r rates (36 of the 40) are in the classes starting with 6.70-under 6.90 and going 7.30-under 7.50. The rates with the greatest frequency, 13, are in the 7. 7.30 class. 2.1 The following data represent the afternoon high temperatures for 50 construc days during a year in St. Louis. 31. 135-12 42 70 64 47 66 69 73 38 48 2% 2 10 55 85 10 24 45 31 62 47/63 84.2 4 16 403 81 15 . 38 79 35 36- 35 17 23 64 40, 36 44 17 v 4.31 38- 52 16 81 75, 53 12 61 43 30 31 -601 33.2 a. Construct a frequency distribution for the data using five class intervals. b. Construct a frequency distribution for the data using 10 class intervals. c. Examine the results of (a) and (b) and comment on the usefulness of the frequency distribution in terms of temperature summarization capability. 2.2 A packaging process is supposed to fill small boxes of raisins with approximately 50 raisins so that each box will weigh the same. However, the number of raisins in each box will vary. Suppose 100 boxes of raisins are randomly sampled, the raisins counted, and the following data are obtained. 57 51 53 52 50 60 51 51 52 52 44 53 45 57 39 53 58 47 51 48 49 49 44 54 46 52 55 54 47 53 49 52 49 54 57 52 52 53 49 47 51 48 55 53 55 47 53 43 48 46 54 46 51 48 53 56 48 47 49 57 55 53 50 47 57 49 43 58 52 44 46 59 57 47 61 60 49 53 41 48 59 53 45 45 56 40 46 49 50 57 47 52 48 50 45 56 47 47 48 46 2.2 QUAN Construct a frequency distribution for these data. What does the frequency distribution reveal about the box fills? 2.3 The owner of a fast-food restaurant ascertains the ages of a sample of customers. From these data, the owner constructs the frequency distribution shown. For each Inte
Step by Step Solution
There are 3 Steps involved in it
Step: 1

Get Instant Access to Expert-Tailored Solutions
See step-by-step solutions with expert insights and AI powered tools for academic success
Step: 2

Step: 3
Ace Your Homework with AI
Get the answers you need in no time with our AI-driven, step-by-step assistance
Get Started
Statistics For Engineers And Scientists
Authors: William Navidi
4th Edition
73401331, 978-0073401331