Answered step by step
Verified Expert Solution
Question
1 Approved Answer
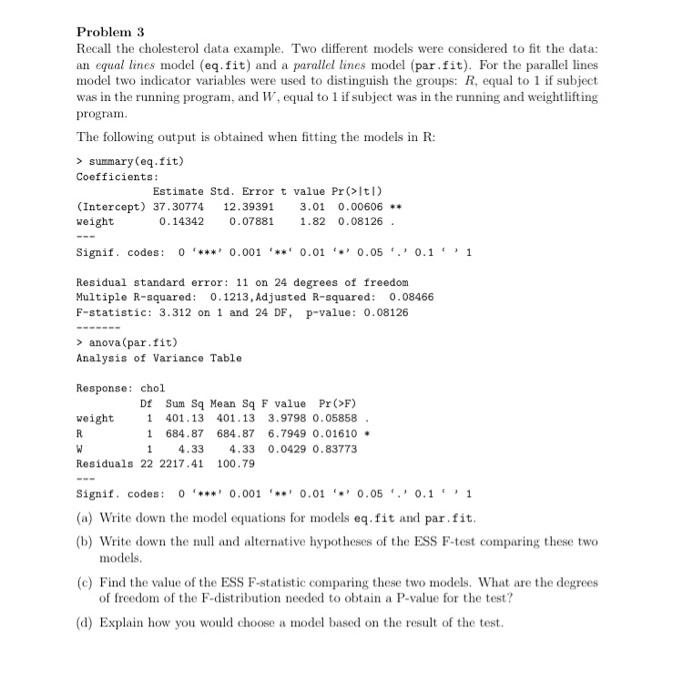
clear please. Problem 3 Recall the cholesterol data example. Two different models were considered to fit the data: an equal lines model (eq. fit) and
clear please. 
Problem 3 Recall the cholesterol data example. Two different models were considered to fit the data: an equal lines model (eq. fit) and a parallel lines model (par.fit). For the parallel lines model two indicator variables were used to distinguish the groups: R, equal to 1 if subject was in the running program, and W. equal to lif subject was in the running and weightlifting program. The following output is obtained when fitting the models in R: > summary (eq.fit) Coefficients: Estimate Std. Error t value Pr>It!) (Intercept) 37.30774 12.39391 3.01 0.00606 ** weight 1.82 0.08126. 0.14342 0.07881 Signif. codes: 0 **** 0.001 '**' 0.01 0.05. 0.11 Residual standard error: 11 on 24 degrees of freedom Multiple R-squared: 0.1213, Adjusted R-squared: 0.08466 F-statistic: 3.312 on 1 and 24 DF, p-value: 0.08126 > anova (par.fit) Analysis of Variance Table Response: chol DE Sum Sq Mean Sq F value Pr (>F) weight 1 401.13 401.13 3.9798 0.05858 R 1 684.87 684.87 6.7949 0.01610 W 1 4.33 4.33 0.0429 0.83773 Residuals 22 2217.41 100.79 Signif. codes: ***' 0.001 0.01 0.05 0.11 (a) Write down the model equations for models eq. fit and par fit. (1) Write down the mill and alternative hypotheses of the ESS F-test comparing these two models. () Find the value of the ESS F-statistic comparing these two models. What are the degrees of freedom of the F-distribution needed to obtain a P-value for the test? (a) Explain how you would choose a model based on the result of the test 
Step by Step Solution
There are 3 Steps involved in it
Step: 1

Get Instant Access to Expert-Tailored Solutions
See step-by-step solutions with expert insights and AI powered tools for academic success
Step: 2

Step: 3

Ace Your Homework with AI
Get the answers you need in no time with our AI-driven, step-by-step assistance
Get Started


