:Clearly answer the following questions.
Phillips Curve with bargaining power's impact on labor productivity. The labor market model and the consequent Phillips Curve that we developed in the lectures assumed constant labor productivity. The evidence suggests that labor productivity grows both in the medium and long run Let us develop a more realistic model that pertains to medium run to evaluate the impact on unemployment rate and real wage of the factors that determine the bargaining power of workers: minimum wage, employment protection legislation, unemployment benefits, collective bargaining, ease with which employers relocate jobs. Recall that all these are captured in what we call catch-all variable, z. As before wage-setting equation is given by W =Pe(1??u+z) (1) Consider the following production function that links the number of workers (N) to (real) out- put/income (Y ) via the level of labor productivity (A): Y = AN (2) It follows that A = Y/N, that is to say, A is output per worker.1 What is the number of workers needed for the production of unit output? If one workers produces A much output then unit output requires 1/A workers. It follows that the cost of production of unit output is W ? (1/A) = W/A where W is the nominal wage rate. Using this observation and by assuming that firms set prices by adding a mark-up on the wage-cost, we can write the price-setting equation as follows: P =(1+m)W (3) A where m is the mark-up rate. As we suggested in the beginning, in the medium run, the labor productivity is not constant at all. Moreover it is very likely that it depends on the bargaining power of workers measured by variable z. Consider the following association between the labor productivity, A, and z: A = 1 + 2z (4) Equation (4) suggests that the greater the bargaining power of workers the higher the level of labor productivity. Plugging A given by equation (4) into the price-setting equation given by equation (3) yields P = 1+mW (5) 1+2z The nominal wage that is compatible with price-setting relation then is W = P (1 + 2z)/(1 + m). Substitute it for the nominal wage in equation (1) to get P(1 + 2z) = Pe(1 ? ?u + z) 1+m Rearranging it gives us the following equation: P =Pe(1+m)(1??u+z) (6) (1+2z) You are almost ready to draw some conclusions!
(a) Derive the Phillips curve using equation (6).
(b) Derive the suggested natural rate of unemployment
(c) What is the real wage that corresponds to the natural rate of unemployment.
(d) Suppose workers win a substantial increase in the minimum wage in the overall economy. What happens to their real wage? What happens to (not so much) natural rate of unem- ployment? Is their achievement self-defeating?
(e) Show the conclusion you obtained in part d on a graph that describes the labor market with wage-setting and price-setting relations (i.e., draw wage-setting and price-setting curve and redraw the ones that shift and highlight the results).
(f) Suppose the coverage of collective bargaining among workers decreases as unions lose their leverage and it gets easier for employers to use the stick of relocating jobs to generate workers' consent for lower pay rises. How does real wage change? What happens to natural rate of unemployment?
(g) Show the conclusion you obtained in part f on a graph that describes the labor market with wage-setting and price-setting relations.
(h) What might be the reasons for the specified positive association between labor productivity and workers' bargaining power? 2For help you can go back to the appendix of chapter 8 in your textbook. 2
(i) Assume the scenario that was described in part f is the case. Consider the constant ?. As workers' bargaining power gets curbed, it is likely that the impact on the real wage of the changes in unemployment rate will be smaller. In other words, as unemployment rate goes down the increase in the real wage will be relatively small. This suggests that in a scenario like the one in f ? will take a smaller value. What does this observation suggest for the natural rate of unemployment you have found in part f?
(j) Founding on the conclusion you drew in part i, what can you recommend to a central bank that, as it monitors the economy, sees that actual unemployment rate remains below the natural rate of unemployment?
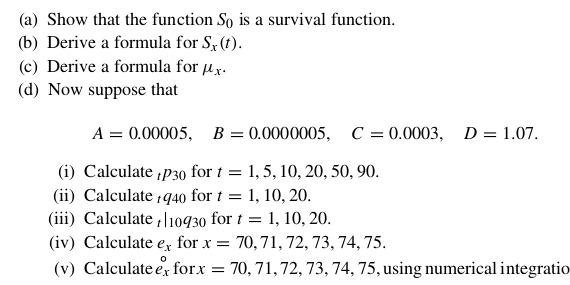
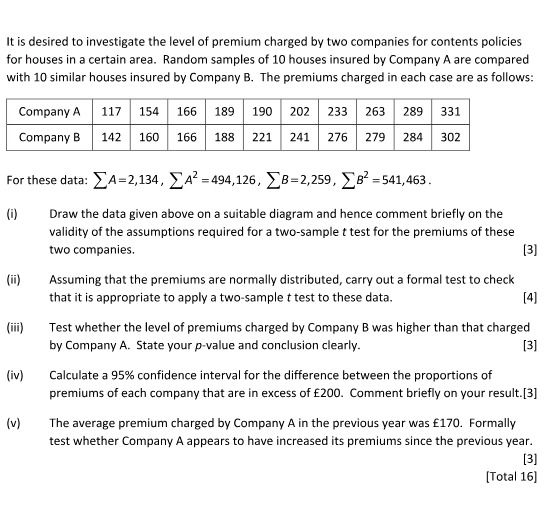
(a) Show that the function So is a survival function. (b) Derive a formula for Sx (t). (c) Derive a formula for /x. (d) Now suppose that A = 0.00005, B = 0.0000005, C = 0.0003, D = 1.07. (i) Calculate , p3o for t = 1, 5, 10, 20, 50, 90. (ii) Calculate /940 for t = 1, 10, 20. (iii) Calculate , |10930 for t = 1, 10, 20. (iv) Calculate ex for x = 70, 71, 72, 73, 74, 75. (v) Calculate ex forx = 70, 71, 72, 73, 74, 75, using numerical integrationIt is desired to investigate the level of premium charged by two companies for contents policies for houses in a certain area. Random samples of 10 houses insured by Company A are compared with 10 similar houses insured by Company B. The premiums charged in each case are as follows: Company A 117 154 166 189 190 202 233 263 289 331 Company B 142 160 166 188 221 241 276 279 284 302 For these data: ) A=2,134, _ AZ =494,126, >8=2,259, > 82 =541,463. (1) Draw the data given above on a suitable diagram and hence comment briefly on the validity of the assumptions required for a two-sample t test for the premiums of these two companies. [3] (ii) Assuming that the premiums are normally distributed, carry out a formal test to check that it is appropriate to apply a two-sample t test to these data. [4] (iii) Test whether the level of premiums charged by Company B was higher than that charged by Company A. State your p-value and conclusion clearly. [3] (iv) Calculate a 95% confidence interval for the difference between the proportions of premiums of each company that are in excess of E200. Comment briefly on your result.[3] (v) The average premium charged by Company A in the previous year was $170. Formally test whether Company A appears to have increased its premiums since the previous year. [3] [Total 16]E .T Use these results to test whether there is an association between the presence of the alleles and the classification into the three AIDS statuses- [5] Insurance claims [in E} arriving at an office over the last month have been analysed. The results are as follows: m Swarm\" Was5\"\" iii Assuming that the maximum claim amount is 10,000: [a] calculate the sample mean of the data [b] test at the S'iii level whether an exponential distribution with parameter xi. is an appropriate distribution for the claim sizes 'I'ou should estimate the value of ri- using the method of moments. [E] [iii An actuary decides to investigate whether claim sizes vary according to die postcode of residence of the claimant- She Splits the data into the three different postcoda observed- The resulis for the rst have postcodes are given below: Postcode 1: mm mm... Postcode 2: swan ............._ \"n\" Test at the 5% level whether claim sizes are independent of the postcodes. [a] [Total 111] A politician has said: 'A recent study in a particular area showed that 25% of the 400 teenagers who were living in single-pa rent families had been in trouble with the police, compared with only 2055 of the 1.200 teenagers who were living in two-pa rent families. Our aim is to reduce the number of 5ing|e~pa rent families in order to reduce the crime rates during the next decade-' [i] Carry out a contingency table test to assess whether there is a signicant association between living in a single-parent family and getting into trouble with the police. Use a 5% level of significance. [5] [ii] Hence. comment on the politician's statement. [1] [Total 6] Exercise 1. a) Let ro E Dy. Show that the definition of the derivative can be rewritten in the equivalent form lim S(z) - f(20) = ['(ro) I - TO b) Using the definition of the derivative you just derived in part a), show that if f is differentiable at zo, then f is continuous at ro. c) Find an example of a function that is continuous but not differentiable at a point mo E Dy. d) Show that the derivative satisfies the linearity property: (of(2) + Bg(.))=a+89 using either form of the definition of the derivative. Here I mean to compute the limit in the definition of the derivative applied to the function of() + 3g(r) and check that the right hand side of this equation above holds. Beyond linearity properties, the derivative operation interacts with other operations on functions. The Leibniz rule: "Here we are intentionally abusing notation a bit for the sake of clarity . we should really think of the the linear mapping So) as distinct from the real mundar f'(c) hit her in the one dimensional Gee the line blur. The distinction is much more clear when we work with multivarialde functions and their Jacobian matrices. IF this is confusing to you, let's talk.Traverse Recreation Company manufactures a single product that is popular with outdoor enthusiasts. The company sells its product to retailers throughout the midwestern section of the United States. It is in the process of creating a master budget for 2020 and reports a balance sheet at December 31, 2019 as follows: The company's chief financial officer (CFO), in consultation with various managers across the organization has developed the following set of assumptions to help create the 2020 budget 1. The budgeted unit sales are 12,000 units, 37,000 units, 15,000 units, and 25,000 units for quarters 1-4, respectively. Notice that the company experiences peak sales in the second and fourth quarters. The budgeted selling price for the year is $32 per unit. The budgeted unit sales for the first quarter of 2021 is 13,000 units. 2. All sales are on credit. Uncollectible accounts are negligible and can be ignored. Seventy-five percent of all credit sales are collected in the quarter of the sale and 25% are collected in the subsequent quarter. 3. Each quarter's ending finished goods inventory should equal 15% of the next quarter's unit sales. 4. Each unit of finished goods requires 3.5 yards of raw material that costs $3.00 per yard. Each quarter's ending raw materials inventory should equal 10% of the next quarter's production needs. The estimated ending raw materials inventory on December 31, 2020 is 5,000 yards. 5. Seventy percent of each quarter's purchases are paid for in the quarter of purchase. The remaining 30% of each quarter's purchases are paid in the following quarter. Direct laborers are paid $18 an hour and each unit of finished goods requires 0.25 direct labor- hours to complete. All direct labor costs are paid in the quarter incurred. 7. The budgeted variable manufacturing overhead per direct labor-hour is $3.00. The quarterly fixed manufacturing overhead is $150,000 including $20,000 of depreciation on equipment. The number of direct labor-hours is used as the allocation base for the budgeted plantwide overhead rate. All overhead costs (excluding depreciation) are paid in the quarter incurred. 8. The budgeted variable selling and administrative expense is $1.25 per unit sold. The fixed selling and administrative expenses per quarter include advertising ($25,000), executive salaries ($64,000), insurance ($12,000), property tax ($8,000), and depreciation expense ($8,000). All selling and administrative expenses (excluding depreciation) are paid in the quarter incurred. 9. The company plans to maintain a minimum cash balance at the end of each quarter of $30,000 Assume that any borrowings take place on the first day of the quarter. To the extent possible, the company will repay principal and interest on any borrowings on the last day of the fourth quarter. The company's lender imposes a simple interest rate of 3% per quarter on any borrowings. 10. Dividends of $15,000 will be declared and paid in each quarter. 11. The company uses a last-in, first-out (LIFO) inventory flow assumption. This means that the most recently purchased raw materials are the "first-out to production and the most recently completed finished goods are the first-out to customers