Click on Analysts Do UALs earnings estimates appear to be more or less promising for the future.


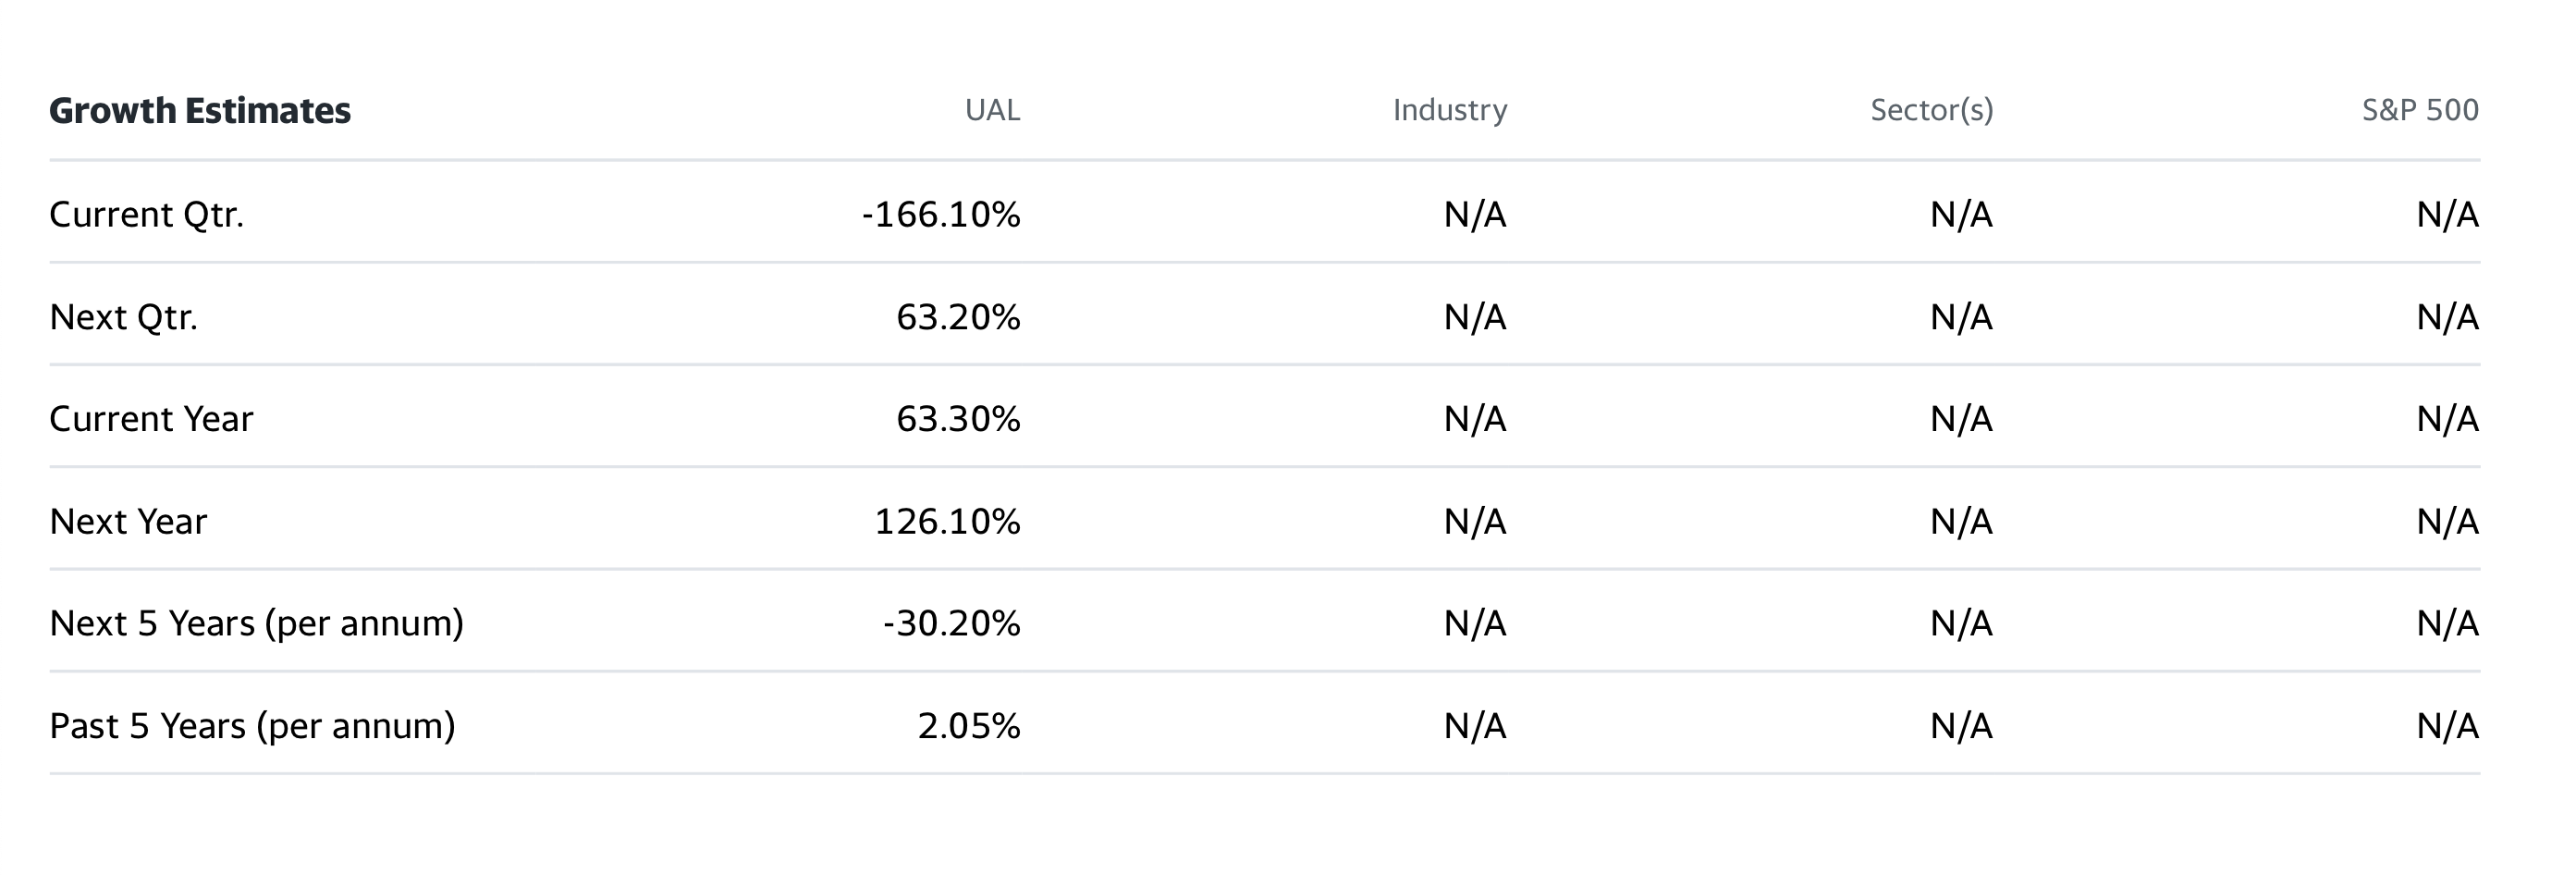
Currency in USD Earnings Estimate Current Qtr. (Mar 2021) Next Qtr. (Jun 2021) Current Year (2021) Next Year (2022) No. of Analysts 17 17 19 19 Avg. Estimate -6.84 -3.43 -10.11 2.64 Low Estimate -7.46 -6.09 -17.16 -5.86 High Estimate -5.75 -1.15 -5.85 6.5 Year Ago EPS -2.57 -9.31 -27.57 -10.11 Revenue Estimate Current Qtr. (Mar 2021) Next Qtr. (Jun 2021) Current Year (2021) Next Year (2022) No. of Analysts 13 13 17 17 Avg. Estimate 3.31B 5.3B 23.13B 34.65B Low Estimate 2.83B 4.31B 19.03B 27.44B High Estimate 3.62B 6.88B 27.16B 38.52B Year Ago Sales 7.98B 1.48B 15.36B 23.13B A Sales Growth (year/est) -58.60% 259.50% 50.60% 49.80% D Earnings History 3/30/2020 6/29/2020 9/29/2020 12/30/2020 EPS Est. -3.47 -9.02 -7.53 -6.64 EPS Actual -2.57 -9.31 -8.16 -7 Difference 0.9 -0.29 -0.63 -0.36 Surprise % 25.90% -3.20% -8.40% -5.40% EPS Trend Current Qtr. (Mar 2021) Next Qtr. (Jun 2021) Current Year (2021) Next Year (2022) Current Estimate -6.84 -3.43 -10.11 2.64 7 Days Ago -6.82 -3.35 -9.87 2.71 30 Days Ago -6.87 -3.17 -9.97 2.94 60 Days Ago -6.84 -3.2 -9.78 3.34 90 Days Ago -4.76 -1.33 -4.91 3.97 EPS Revisions Current Qtr. (Mar 2021) Next Qtr. (Jun 2021) Current Year (2021) Next Year (2022) Up Last 7 Days N/A N/A N/A N/A Up Last 30 Days 4 N/A 1 2 Down Last 7 Days N/A N/A N/A N/A Down Last 30 Days 1 1 1 1 Growth Estimates UAL Industry Sector(s) S&P 500 Current Qtr. -166.10% N/A N/A N/A Next Qtr. 63.20% N/A N/A N/A Current Year 63.30% N/A N/A N/A Next Year 126.10% N/A N/A N/A Next 5 Years (per annum) -30.20% N/A N/A N/A Past 5 Years (per annum) 2.05% N/A N/A N/A Currency in USD Earnings Estimate Current Qtr. (Mar 2021) Next Qtr. (Jun 2021) Current Year (2021) Next Year (2022) No. of Analysts 17 17 19 19 Avg. Estimate -6.84 -3.43 -10.11 2.64 Low Estimate -7.46 -6.09 -17.16 -5.86 High Estimate -5.75 -1.15 -5.85 6.5 Year Ago EPS -2.57 -9.31 -27.57 -10.11 Revenue Estimate Current Qtr. (Mar 2021) Next Qtr. (Jun 2021) Current Year (2021) Next Year (2022) No. of Analysts 13 13 17 17 Avg. Estimate 3.31B 5.3B 23.13B 34.65B Low Estimate 2.83B 4.31B 19.03B 27.44B High Estimate 3.62B 6.88B 27.16B 38.52B Year Ago Sales 7.98B 1.48B 15.36B 23.13B A Sales Growth (year/est) -58.60% 259.50% 50.60% 49.80% D Earnings History 3/30/2020 6/29/2020 9/29/2020 12/30/2020 EPS Est. -3.47 -9.02 -7.53 -6.64 EPS Actual -2.57 -9.31 -8.16 -7 Difference 0.9 -0.29 -0.63 -0.36 Surprise % 25.90% -3.20% -8.40% -5.40% EPS Trend Current Qtr. (Mar 2021) Next Qtr. (Jun 2021) Current Year (2021) Next Year (2022) Current Estimate -6.84 -3.43 -10.11 2.64 7 Days Ago -6.82 -3.35 -9.87 2.71 30 Days Ago -6.87 -3.17 -9.97 2.94 60 Days Ago -6.84 -3.2 -9.78 3.34 90 Days Ago -4.76 -1.33 -4.91 3.97 EPS Revisions Current Qtr. (Mar 2021) Next Qtr. (Jun 2021) Current Year (2021) Next Year (2022) Up Last 7 Days N/A N/A N/A N/A Up Last 30 Days 4 N/A 1 2 Down Last 7 Days N/A N/A N/A N/A Down Last 30 Days 1 1 1 1 Growth Estimates UAL Industry Sector(s) S&P 500 Current Qtr. -166.10% N/A N/A N/A Next Qtr. 63.20% N/A N/A N/A Current Year 63.30% N/A N/A N/A Next Year 126.10% N/A N/A N/A Next 5 Years (per annum) -30.20% N/A N/A N/A Past 5 Years (per annum) 2.05% N/A N/A N/A


