

Answered step by step
Verified Expert Solution
Question
1 Approved Answer
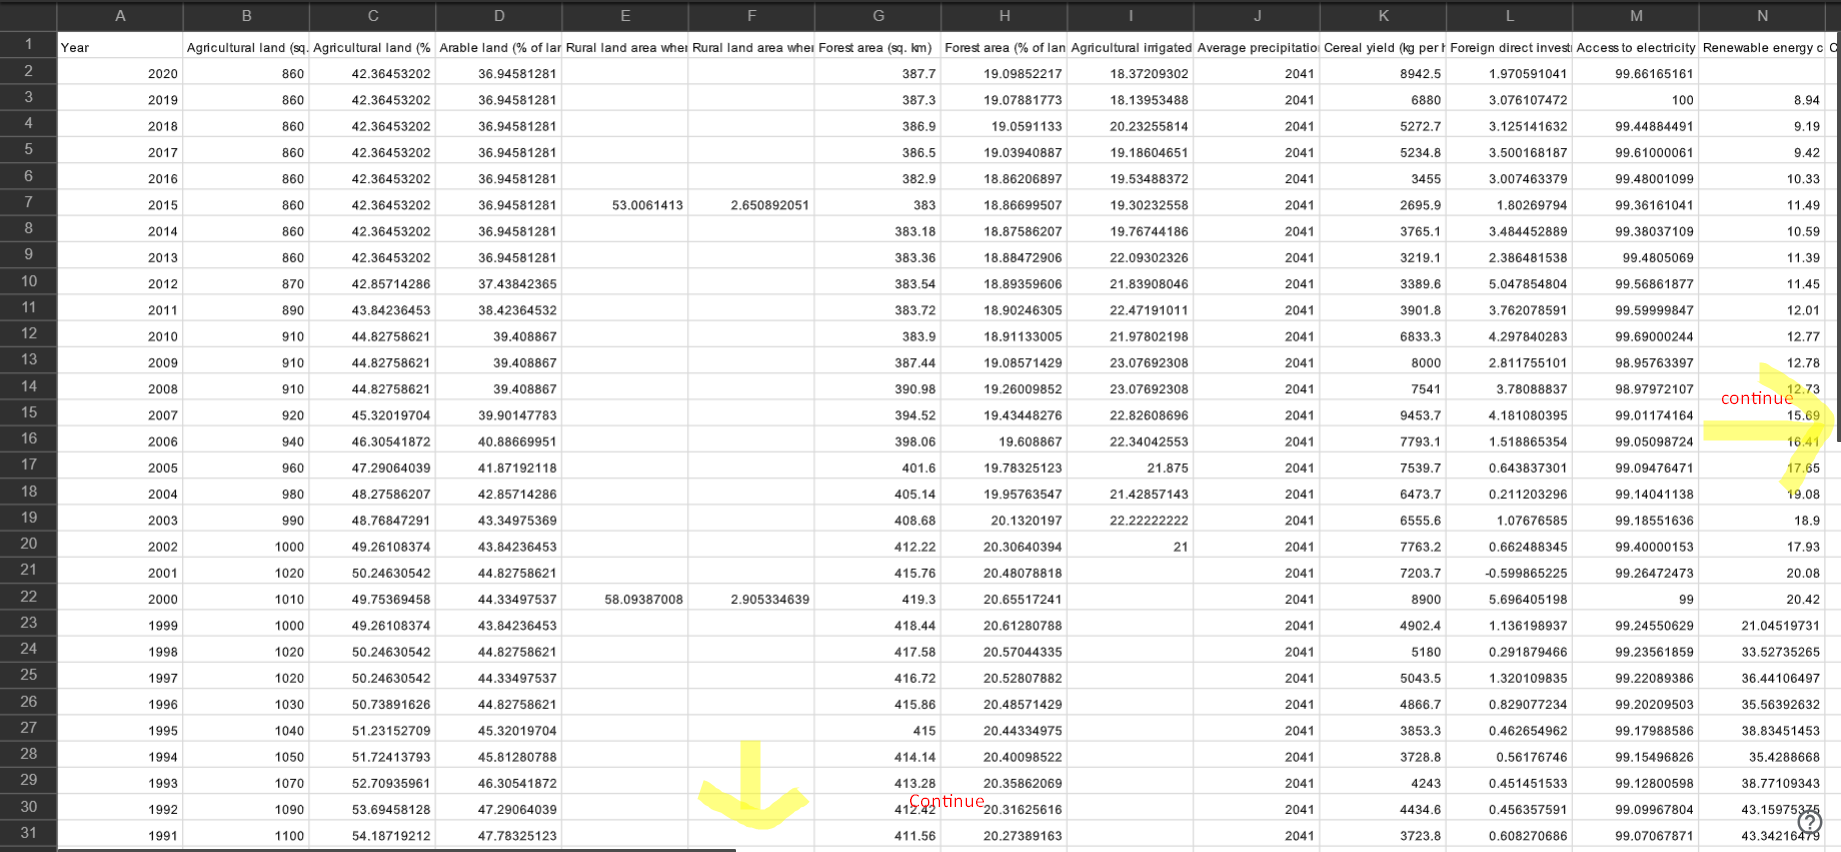
Climate Change in Mauritius Using the Climate _ Change _ Mauritius.csv ( it is a set of data on excel as shown in the
Climate Change in Mauritius
Using the "ClimateChangeMauritius.csvit is a set of data on excel as shown in the picture. i could not upload the data as it too big dataset provided design a python code which is able to achieve the following
tasks:
i data exploration eg measures of central tendency
ii identification and mitigation of anomalies eg extreme values
iii determining feature importance eg using correlation functions
iv feature engineering eg addition or removal of columns
v generate relevant visualization of the data eg using matplotlib or seaborn
You are free to select which type of analysis you carry out on the dataset and which
portion of the data you display as a graph or chart. You should consider how to
demonstrate as wide a range of abilities, for example, abilities in matplotlib or
seaborn can be demonstrated by providing a set of data in a welldocumented line
graph, and further extended by demonstrating how to present other data in a bar
chart. Additionally, please provide any inferences on climate change in Mauritius
which you may have uncovered while working with this dataset.
Step by Step Solution
There are 3 Steps involved in it
Step: 1

Get Instant Access to Expert-Tailored Solutions
See step-by-step solutions with expert insights and AI powered tools for academic success
Step: 2

Step: 3
Ace Your Homework with AI
Get the answers you need in no time with our AI-driven, step-by-step assistance
Get Started
Learning MySQL Get A Handle On Your Data
Authors: Seyed M M Tahaghoghi
1st Edition
0596529465, 9780596529468