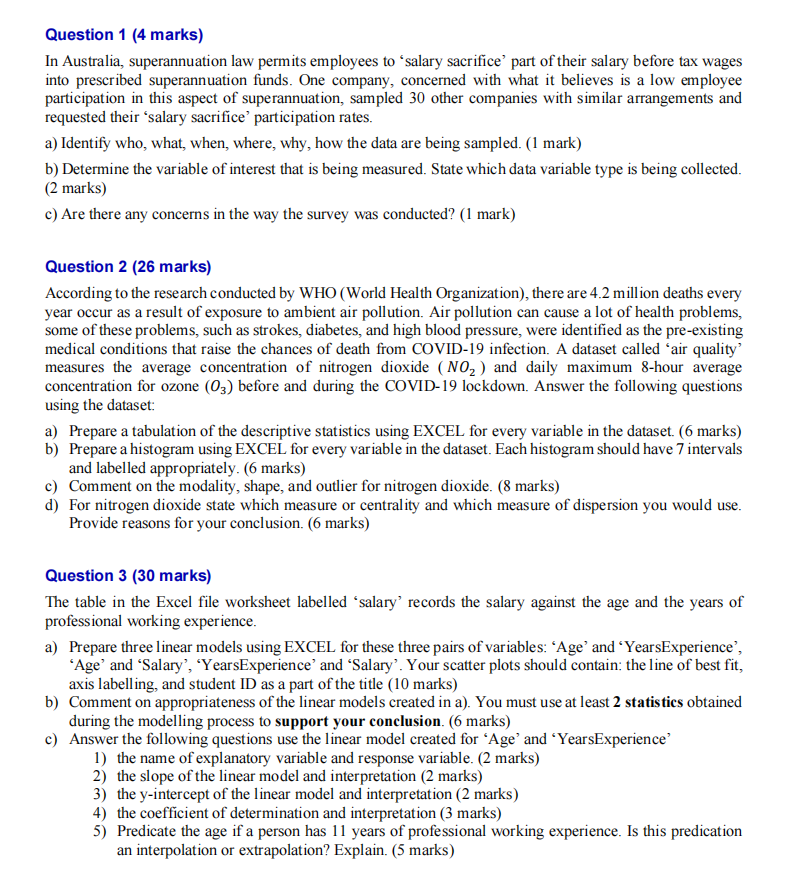
Cluestlon 1 {4 marks} In Australia, superamtuation law permits employees to 'salary sacrifice' part of their salary before tax wages into prescroed superannuation fimds. One company, concerned with what it believes is a low employee participation in this aspect of superannuation, sampled 3D other companies with similar arrangements and requested their 'salary sacrifice' participation rates. a) Identify who, what, when, where, why, how the data are being sampled. { 1 mark) b) Determine the variable of interest that is being measured. State which data variable type is being collected. {2 marks) c) Are there any concerns in the way the survey was conducted?l (1 mark) Questlon 2 {26 marks} According to the research conducted by WHO {World Health llllrganisation), there are 4.2 million deaths every year occur as a result of exposure to ambient air pollution. Air pollution can cause a lot of health problems, some of these problems, such as strokes, diabetes, and high blood pressure, were identified as the pre-existing medical conditions that raise the chances of death om COVE-19 infection. A dataset called 'air quality' measures the average concentration of nitrogen dioxide { N02 J and daily maximum 3-hour average concentration for ozone {:93} before and during the COMB-19 lockdown. Answer the following questions using the dataset: a] Prepare a tabulation of the descriptive statistics using EXCEL for every variable in the dataset. {6 marks) b) Prepare a histogram using EXCEL for every variable in the dataset. Each histogram should have 7 intervals and labelled appropriately. to marks) c) Comment on the modality, shape, and outlier for nitrogen dioxide. (3 marks) d) For nitrogen dioxide state which measure or centrality and which measure of dispersion you would use. Provide reasons for your conclusion. (6 marks) Queetlon 3 [30 marks} The table in the Excel file worksheet labelled 'salary' records the salary against the age and the years of professional working experience. a) Prepare three linear models using EXCEL for these three pairs of var iables: 'Age' and 'YearsExperience', 'Age' and 'Salary', 'YearsExperience' and 'Salary'. Your scatter plots should contain: the line of best fit, axis labelling, and student ID as a part of the title {ll} marks) b) Comment on appropriatenem of the linear models created in a). You must use at least 2 statistics obtained during the modelling process to support your conclusion. {6 marks) c] Answer the following questions use the linear model created for 'Age' and 'YearsExperience' 1) the name of explanatory variable and response variable. {2 marks) 2) the slope of the linear model and interpretation {2 marks) 3) the y-intercept of the linear model and Interpretation {2 marks) 4) the coefcth of determination and interpretation {3 marks) 5) Predicate the age if a person has 11 years of professional working experience. Is this predication an interpolation or extrapolation? Explain. {5 marks)


