College Algebra
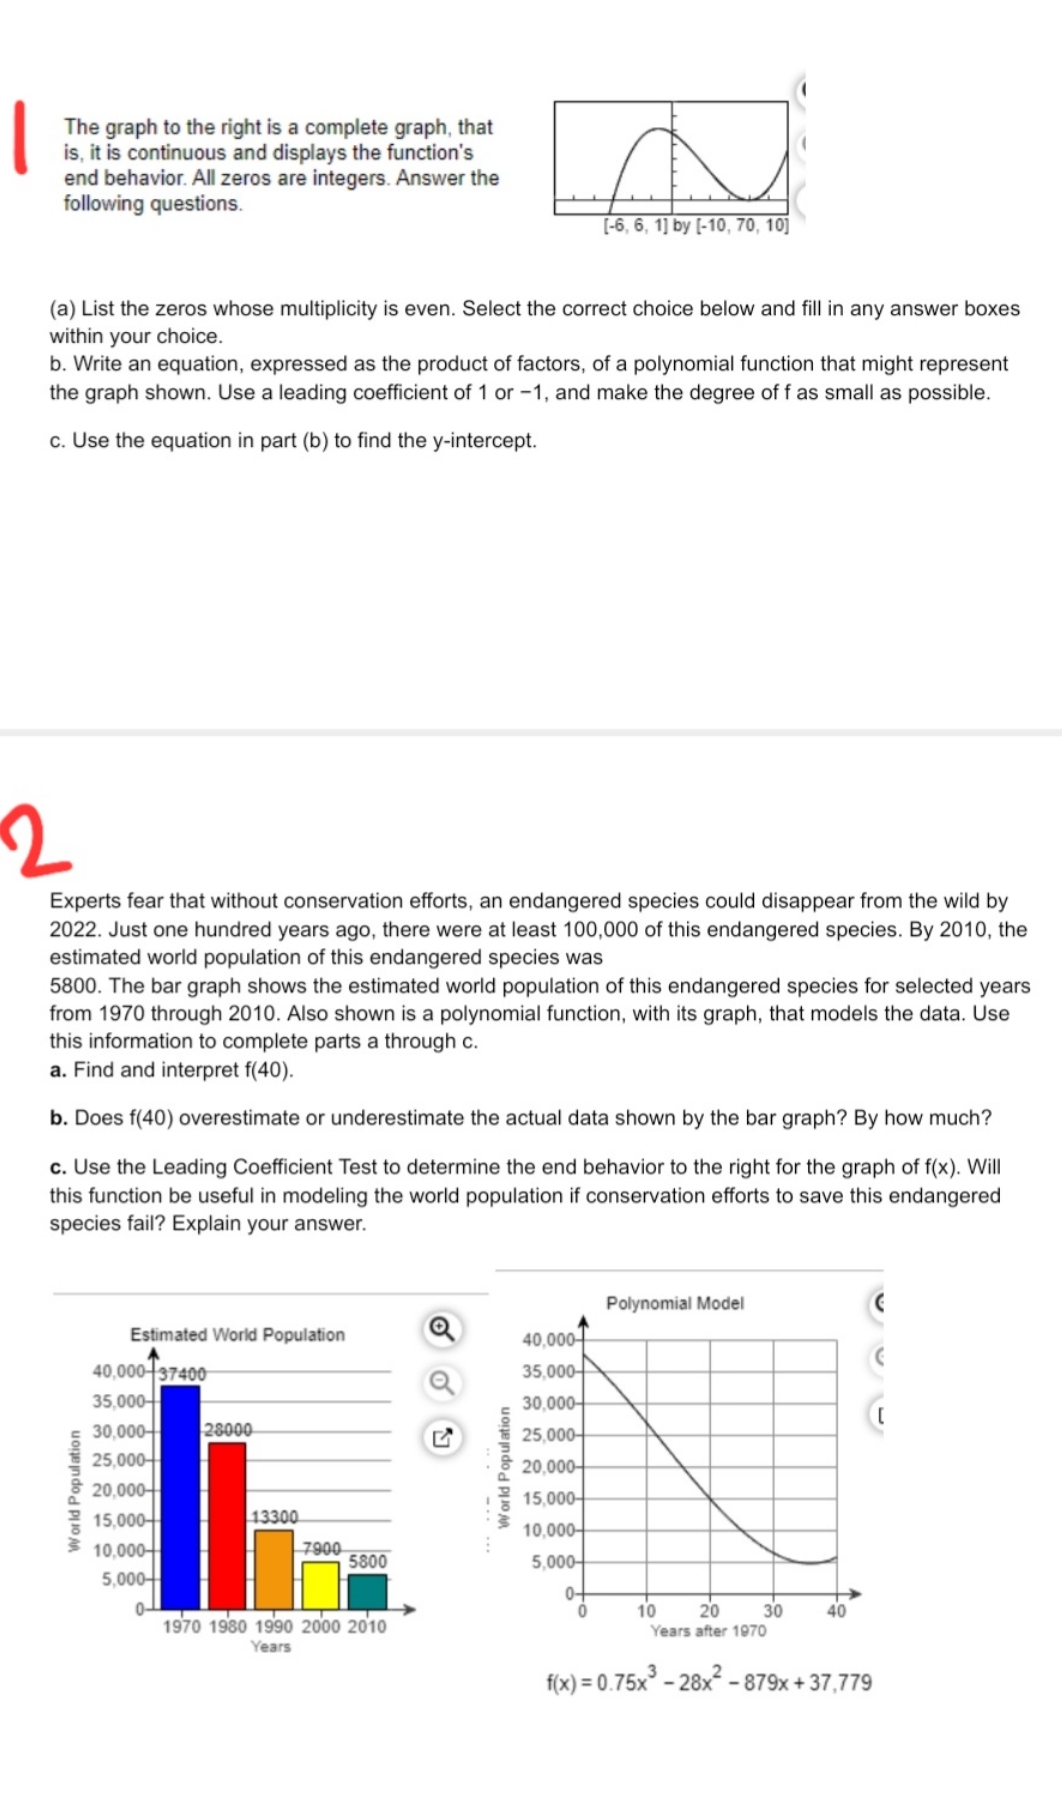
The graph to the right is a complete graph, that is, it is continuous and displays the function's end behavior. All zeros are integers. Answer the following questions. [-6, 6, 1] by [-10, 70, 10] (a) List the zeros whose multiplicity is even. Select the correct choice below and fill in any answer boxes within your choice. b. Write an equation, expressed as the product of factors, of a polynomial function that might represent the graph shown. Use a leading coefficient of 1 or -1, and make the degree of f as small as possible. c. Use the equation in part (b) to find the y-intercept. 2 Experts fear that without conservation efforts, an endangered species could disappear from the wild by 2022. Just one hundred years ago, there were at least 100,000 of this endangered species. By 2010, the estimated world population of this endangered species was 5800. The bar graph shows the estimated world population of this endangered species for selected years from 1970 through 2010. Also shown is a polynomial function, with its graph, that models the data. Use this information to complete parts a through c. a. Find and interpret f(40). b. Does f(40) overestimate or underestimate the actual data shown by the bar graph? By how much? c. Use the Leading Coefficient Test to determine the end behavior to the right for the graph of f(x). Will this function be useful in modeling the world population if conservation efforts to save this endangered species fail? Explain your answer. Polynomial Model Estimated World Population 40,000- 40,000- 37400 35,000- 35,000- 30,000- 30,000- 28000 25,000- 25,000- World Population 20,000- World Population 20.000- 15,000- 15,000- 13300 . . . .. 10,000- 10,000- 7900 5800 5,000- 5,000- 10 20 30 40 1970 1980 1990 2000 2010 Years after 1970 Years f(x) = 0.75x - 28x2 - 879x + 37,779