Answered step by step
Verified Expert Solution
Question
1 Approved Answer
Comment on the Financials Projections. Do you see the forecasted sales units and revenue reasonable? Why/Why Not? Is it connected to the Market Analysis? Can


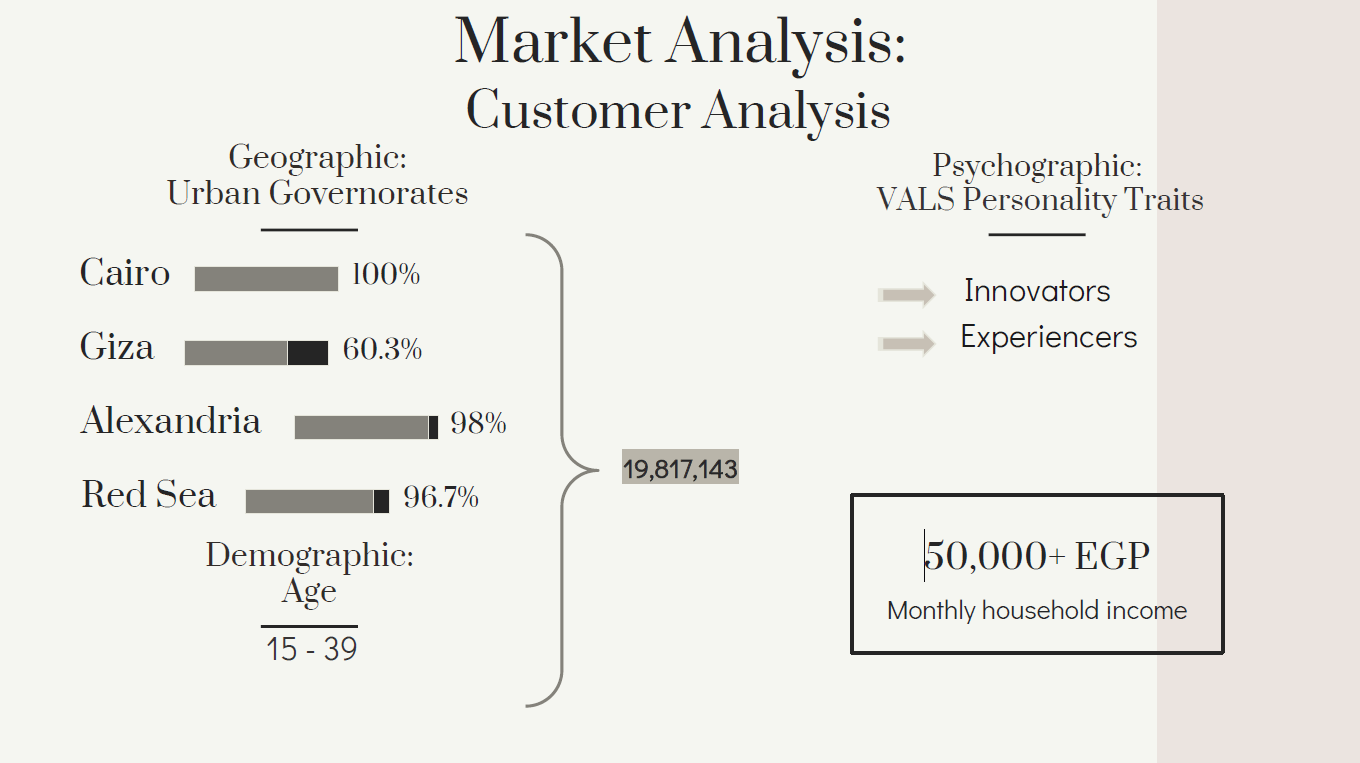
Comment on the Financials Projections. Do you see the forecasted sales units and revenue reasonable? Why/Why Not? Is it connected to the Market Analysis? Can you provide a different forecast for sales units and revenue? If so provide a table for these two factors (forecasted sales units and revenue) and explain your rational.
Market Analysis: Customer Analysis Geographic: Psychographic: Urban Governorates VALS Personality Traits Cairo 100% Innovators Experiencers Giza 60.3% Alexandria 98% 19,817,143 Red Sea 96.7% Demographic: Age |50,000+ EGP Monthly household income 15 - 39 Year 3 04 Y2 Q1 Q2 Q3 04 Y3 18.45 22.7 8.405 25.215 58.835 75.645 168.1 56.75 21.01 Year 1 Year 2 Q1 Q2 03 04 Y1 Q1 Q2 93 Sales unit (in thousands) 0.5 1.5 3.5 4.5 10 2.05 6.15 14.35 Sales revenue (million LE) 1.25 3.75 8.75 1125 25 5.125 15.375 35.875 |- COGS 52500 127500 277500 352500 765000 168750 476250 1091250 Gross Profit 1,197,500 3,622,500 8,473,500 10,897,500 242,335,000 4,956,250 14,898,750 34,783,750 1- SG&A 155,000 145,000 145,000 145,000 590,000 160,000 165,000 165,000 EBIT 1,042,500 3,477,500 8,328,500 10,752,500 241,745,000 4,796,250 14,733,750 34,618,750 Cumulative 1,042,500 4,520,000 12,848,500 23,601,000 265,346,000 270,142.250 284.876,000 319,494,750 Profit 46.125 1398750 34,783,750 170,000 1717500 645375 5,503,250 20,364,625 660,000 160,000 4,843,250 20,204.625 358.951.750 379.156,375 63.0375 147,0875 189.1125 420.25 1906125 4427625 5688375 12622500 61,131,375 114,087,500 183,424,125 407,627,500 160,000 145,000 150,000 615,000 60,971,375 113,942,500 183,274,125 407,012,500 440,127,750 554,070,250 737,344.375 1.144,356,875 34,613,750 354.108.500 Market Analysis: Customer Analysis Geographic: Psychographic: Urban Governorates VALS Personality Traits Cairo 100% Innovators Experiencers Giza 60.3% Alexandria 98% 19,817,143 Red Sea 96.7% Demographic: Age |50,000+ EGP Monthly household income 15 - 39 Year 3 04 Y2 Q1 Q2 Q3 04 Y3 18.45 22.7 8.405 25.215 58.835 75.645 168.1 56.75 21.01 Year 1 Year 2 Q1 Q2 03 04 Y1 Q1 Q2 93 Sales unit (in thousands) 0.5 1.5 3.5 4.5 10 2.05 6.15 14.35 Sales revenue (million LE) 1.25 3.75 8.75 1125 25 5.125 15.375 35.875 |- COGS 52500 127500 277500 352500 765000 168750 476250 1091250 Gross Profit 1,197,500 3,622,500 8,473,500 10,897,500 242,335,000 4,956,250 14,898,750 34,783,750 1- SG&A 155,000 145,000 145,000 145,000 590,000 160,000 165,000 165,000 EBIT 1,042,500 3,477,500 8,328,500 10,752,500 241,745,000 4,796,250 14,733,750 34,618,750 Cumulative 1,042,500 4,520,000 12,848,500 23,601,000 265,346,000 270,142.250 284.876,000 319,494,750 Profit 46.125 1398750 34,783,750 170,000 1717500 645375 5,503,250 20,364,625 660,000 160,000 4,843,250 20,204.625 358.951.750 379.156,375 63.0375 147,0875 189.1125 420.25 1906125 4427625 5688375 12622500 61,131,375 114,087,500 183,424,125 407,627,500 160,000 145,000 150,000 615,000 60,971,375 113,942,500 183,274,125 407,012,500 440,127,750 554,070,250 737,344.375 1.144,356,875 34,613,750 354.108.500Step by Step Solution
There are 3 Steps involved in it
Step: 1

Get Instant Access to Expert-Tailored Solutions
See step-by-step solutions with expert insights and AI powered tools for academic success
Step: 2

Step: 3

Ace Your Homework with AI
Get the answers you need in no time with our AI-driven, step-by-step assistance
Get Started


