Question
Common size financial statements will help you in your time-series analysis and will give you a better idea of what is going on in the
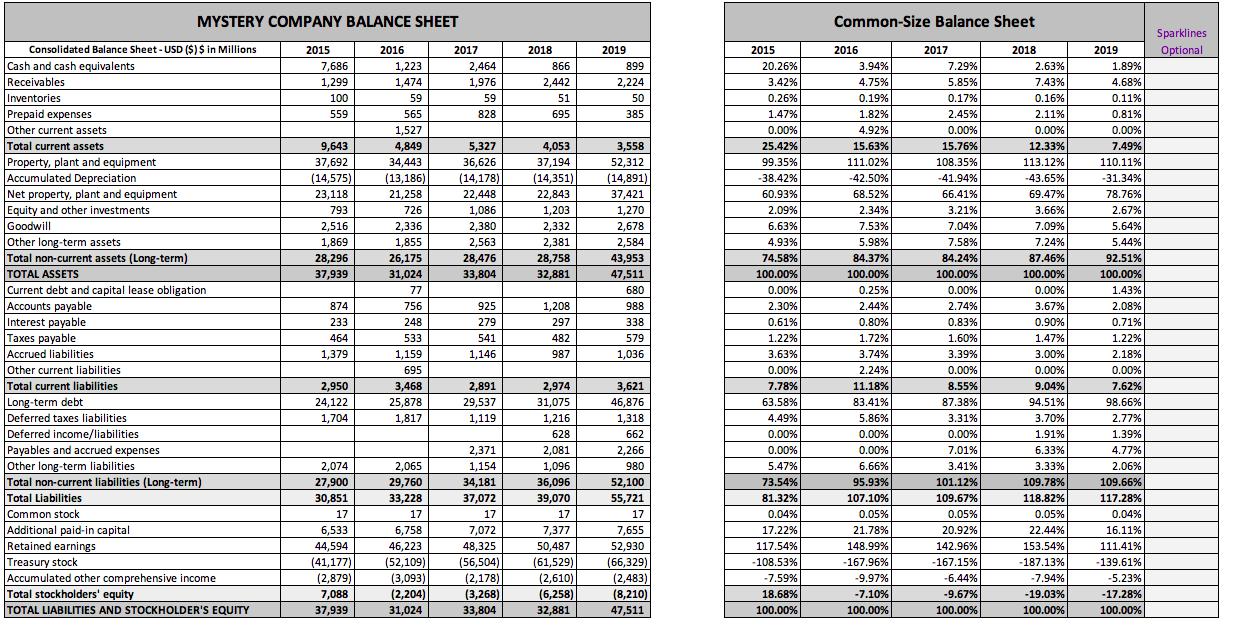
Common size financial statements will help you in your time-series analysis and will give you a better idea of what is going on in the company. Go to the Income Statement and the Balance Sheet tabs and create a common-size statement out to the side of the original ones. Then complete a financial statement analysis listing a few points of interest. You should also mention some of your findings in your Summary (Part 4). (A financial statement analysis is basically just taking a look at the financial statements to get an overall picture of the company. For instance, by looking at the amount of revenues generated, you can get an idea about the size of a company and by looking at multiple years, you can learn if the revenues are growing or declining. Both are important bits of information about the company.) < I need help with my balance sheet analysis.


MYSTERY COMPANY INCOME STATEMENT Common Size Income Statement 12 Months Ended Consolidated Statement of Income - USD ($) shares in Millions, $ in Millions Fiscal year ends in December. USD in millions except per share data. Sparklines 2015 2016 2017 2018 2019 2015 2016 2017 2018 2019 Optional Revenue (Sales) Cost of revenue (COGS) Gross profit Sales, General and administrative Other Operating Income/Expense 25,413 24,622 22,820 21,025 21,076 100.000% 100.000% 100.000% 100.000% 100.000% 15,624 14,417 12,200 10,239 9,961 61.48% 58.55% 53.46% 48.70% 47.26% 9,789 10,205 10,620 10,786 11,115 38.52% 41.45% 46.54% 51.30% 52.74% 2,434 2,385 2,231 2,200 2,229 9.58% 9.69% 9.78% 10.46% 10.58% Total operating expenses Operating income (Also called EBIT) Net Interest Expense Net Investment Income 2,434 2,385 2,231 2,200 2,229 9.58% 9.69% 9.78% 10.46% 10.58% 7,355 7,820 8,389 8,586 8,886 28.94% 31.76% 36.76% 40.84% 42.16% 629 881 914 977 1,085 2.48% 3.58% 4.01% 4.65% 5.15% (91) (63) (17) 6,555 79 158 147 202 0.36% 0.32% 0.69% 0.70% 0.96% Irrigular Income/Expense Other income/Expense lIncome before taxes Provision for income taxes Net income (130) (22) 979 85 30 -0.25% -0.53% 4.29% 0.40% 0.14% (39) (25) (15) 0.07% -0.09% 0.17% -0.12% -0.07% 6,866 8,573 7,816 8,018 25.79% 27.89% 37.57% 37.17% 38.04% 2,026 2,180 3,381 1,892 1,993 7.97% 8.85% 14.82% 9.00% 9.46% 4,529 4,686 5,192 5,924 6,025 17.82% 19.03% 22.75% 28.18% 28.59% Sparklines are a helpful tool in determining trends. They are very easy to do. Earnings per share Weighted average shares outstanding Click in the cell where you want the sparkline. Click "Insert" at the top of the spreadsheet Find "Sparklines" on the toolbar and click "Line" 4.82 5.49 6.43 7.61 7.95 939 854 807 778 758 Market Price of Mystery Company's Stock A pop-up box will appear Click in the Date Range box and then highlight the five years of data on your 118 122 172 175 198 Use this for your Market Ratios spreadsheet and click enter
Step by Step Solution
3.42 Rating (161 Votes )
There are 3 Steps involved in it
Step: 1
The total current assets ...
Get Instant Access to Expert-Tailored Solutions
See step-by-step solutions with expert insights and AI powered tools for academic success
Step: 2

Step: 3

Ace Your Homework with AI
Get the answers you need in no time with our AI-driven, step-by-step assistance
Get Started


