Answered step by step
Verified Expert Solution
Question
1 Approved Answer
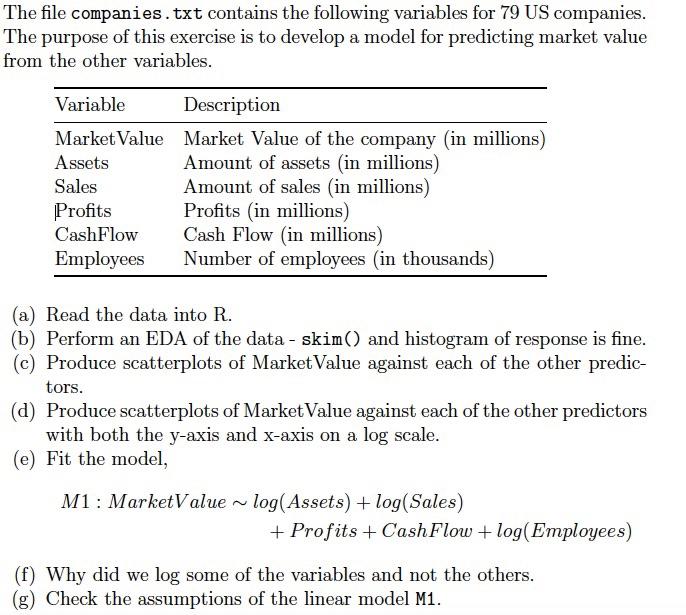
companies.txt Assets Sales MarketValue Profits CashFlow Employees 2687 1870 1890 145.7 352.2 18.2 13271 9115 8190 -279.0 83.0 143.8 13621 4848 4572 485.0 898.9 23.4

companies.txt
Assets Sales MarketValue Profits CashFlow Employees
2687 1870 1890 145.7 352.2 18.2
13271 9115 8190 -279.0 83.0 143.8
13621 4848 4572 485.0 898.9 23.4
3614 367 90 14.1 24.6 1.1
6425 6131 2448 345.8 682.5 49.5
1022 1754 1370 72.0 119.5 4.8
1093 1679 1070 100.9 164.5 20.8
1529 1295 444 25.6 137.0 19.4
2788 271 304 23.5 28.9 2.1
19788 9084 10636 1092.9 2576.8 79.4
327 542 959 54.1 72.5 2.8
1117 1038 478 59.7 91.7 3.8
5401 550 376 25.6 37.5 4.1
1128 1516 430 -47.0 26.7 13.2
1633 701 679 74.3 135.9 2.8
44736 16197 4653 -732.5 -651.9 48.5
5651 1254 2002 310.7 407.9 6.2
5835 4053 1601 -93.8 173.8 10.8
278 205 853 44.8 50.5 3.8
5074 2557 1892 239.9 578.3 21.9
866 1487 944 71.7 115.4 12.6
4418 8793 4459 283.6 456.5 128.0
6914 7029 7957 400.6 754.7 87.3
862 1601 1093 66.9 106.8 16.0
401 176 1084 55.6 57.0 0.7
430 1155 1045 55.7 70.8 22.5
799 1140 683 57.6 89.2 15.4
4789 453 367 40.2 51.4 3.0
2548 264 181 22.2 26.2 2.1
5249 527 346 37.8 56.2 4.1
3494 1653 1442 160.9 320.3 6.4
1804 2564 483 70.5 164.9 26.6
26432 28285 33172 2336.0 3562.0 304.0
623 2247 797 57.0 93.8 18.6
1608 6615 829 56.1 134.0 65.0
4662 4781 2988 28.7 371.5 66.2
5769 6571 9462 482.0 792.0 83.0
6259 4152 3090 283.7 524.5 62.0
1654 451 779 84.8 130.4 1.6
52634 50056 95697 6555.0 9874.0 400.2
999 1878 393 -173.5 -108.1 23.3
1679 1354 687 93.8 154.6 4.6
4178 17124 2091 180.8 390.4 164.6
223 557 1040 60.6 63.7 1.9
6307 8199 598 -771.5 -524.3 57.5
3720 356 211 26.6 34.8 2.4
3442 5080 2673 235.4 361.5 77.3
33406 3222 1413 201.7 246.7 15.8
1257 355 181 167.5 304.0 0.6
1743 597 717 121.6 172.4 3.5
12505 1302 702 108.4 131.4 9.0
3940 4317 3940 315.2 566.3 62.0
8998 882 988 93.0 119.0 7.4
21419 2516 930 107.6 164.7 15.6
2366 3305 1117 131.2 256.5 25.2
2448 3484 1036 48.8 257.1 25.4
1440 1617 639 81.7 126.4 3.5
14045 15636 2754 418.0 1462.0 27.3
4084 4346 3023 302.7 521.7 37.5
3010 749 1120 146.3 209.2 3.4
1286 1734 361 69.2 145.7 14.3
707 706 275 61.4 77.8 6.1
3086 1739 1507 202.7 335.2 4.9
252 312 883 41.7 60.6 3.3
11052 1097 606 64.9 97.6 7.0
9672 1037 829 92.6 118.2 8.2
1112 3689 542 30.3 96.9 43.5
1104 5123 910 63.7 133.3 48.5
478 672 866 67.1 101.6 5.4
10348 5721 1915 223.6 322.5 49.5
2769 3725 663 -208.4 12.4 29.1
752 2149 101 11.1 15.2 2.6
4989 518 53 -3.1 -0.3 0.8
10528 14992 5377 312.7 710.7 184.8
1995 2662 341 34.7 100.7 2.3
2286 2235 2306 195.3 219.0 8.0
952 1307 309 35.4 92.8 10.3
2957 2806 457 40.6 93.5 50.0
2535 5958 1921 177.0 288.0 118.1
Step by Step Solution
There are 3 Steps involved in it
Step: 1

Get Instant Access to Expert-Tailored Solutions
See step-by-step solutions with expert insights and AI powered tools for academic success
Step: 2

Step: 3

Ace Your Homework with AI
Get the answers you need in no time with our AI-driven, step-by-step assistance
Get Started


