COMPANY ABCD:
Risk free data:
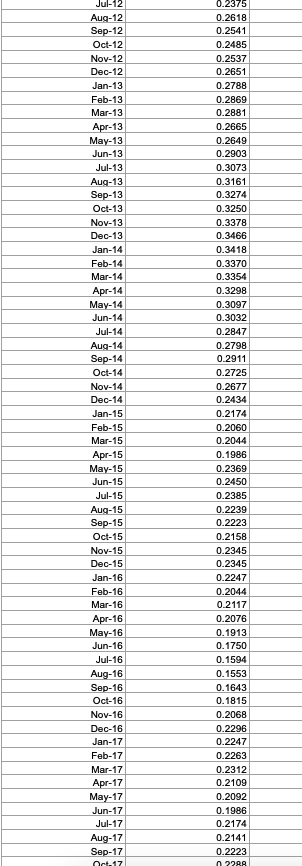
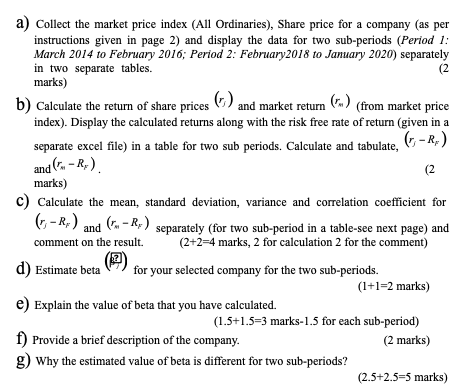
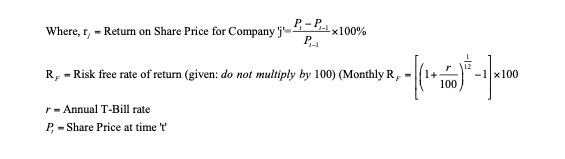
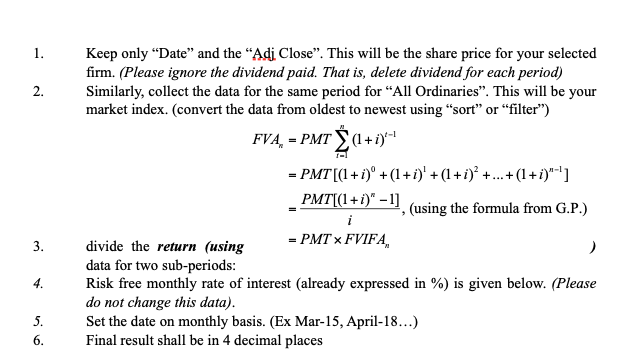
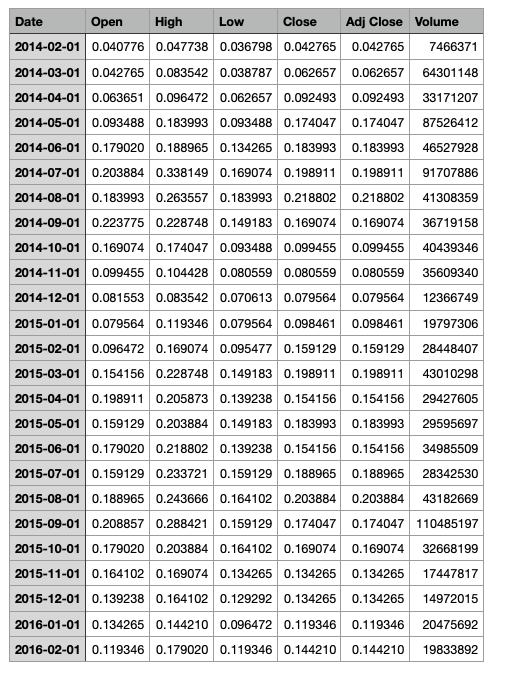
a) Collect the market price index (All Ordinaries), Share price for a company (as per instructions given in page 2) and display the data for two sub-periods (Period 1: March 2014 to February 2016; Period 2: February2018 to January 2020) separately in two separate tables. (2 marks) b) Calculate the return of share prices and market return (n) (from market price index). Display the calculated returns along with the risk free rate of return (given in a separate excel file) in a table for two sub periods. Calculate and tabulate, (-R) and (.-R.). (2 marks) c) Calculate the mean, standard deviation, variance and correlation coefficient for (-Rs) and (L-R) (-.-Ry) separately (for two sub-period in a table-see next page) and comment on the result. (2+2=4 marks, 2 for calculation 2 for the comment) d) Estimate beta for your selected company for the two sub-periods. (1+1=2 marks) e) Explain the value of beta that you have calculated. (1.5+1.5=3 marks-1.5 for each sub-period) f) Provide a brief description of the company. (2 marks) g) Why the estimated value of beta is different for two sub-periods? (2.5+2.5=5 marks) P.-PLY Where, r, - Return on Share Price for Company ) -X100% P. RE-Risk free rate of return (given: do not multiply by 100) (Monthly R, -1x100 100 r - Annual T-Bill rate P - Share Price at time 1. 2. Keep only Date and the Adi Close. This will be the share price for your selected firm. (Please ignore the dividend paid. That is, delete dividend for each period) Similarly, collect the data for the same period for All Ordinaries. This will be your market index. (convert the data from oldest to newest using "sort" or "filter") FVA - PMT (1+i) = PMT[(1+i) +(1+i)' +(1+i) + ... + (1+i)***] PMT[(1+i)" - 1] (using the formula from G.P.) divide the return (using = PMT X FVIFA, data for two sub-periods: Risk free monthly rate of interest (already expressed in %) is given below. (Please do not change this data). Set the date on monthly basis. (Ex Mar-15, April-18...) Final result shall be in 4 decimal places 3. 4. 5. 6. Date Open High Low Close Adj Close Volume 2014-02-01 0.040776 0.047738 0.036798 0.042765 0.042765 7466371 2014-03-01 0.042765 0.083542 0.038787 0.062657 0.062657 64301148 2014-04-01 0.063651 0.096472 0.062657 0.092493 0.092493 33171207 2014-05-01 0.093488 0.183993 0.093488 0.174047 0.174047 87526412 2014-06-01 0.179020 0.188965 0.134265 0.183993 0.183993 46527928 2014-07-01 0.203884 0.338149 0.169074 0.198911 0.198911 91707886 2014-08-01 0.183993 0.263557 0.183993 0.218802 0.218802 41308359 2014-09-01 0.223775 0.228748 0.149183 0.169074 0.169074 36719158 2014-10-01 0.169074 0.174047 0.093488 0.099455 0.099455 40439346 2014-11-01 0.099455 0.104428 0.080559 0.080559 0.080559 35609340 2014-12-01 0.081553 0.083542 0.070613 0.079564 0.079564 12366749 2015-01-01 0.079564 0.119346 0.079564 0.098461 0.098461 19797306 2015-02-01 0.096472 0.169074 0.095477 0.159129 0.159129 28448407 2015-03-01 0.154156 0.228748 0.149183 0.198911 0.198911 43010298 2015-04-01 0.198911 0.205873 0.139238 0.154156 0.154156 29427605 2015-05-01 0.159129 0.203884 0.149183 0.183993 0.183993 29595697 2015-06-01 0.179020 0.218802 0.139238 0.154156 0.154156 34985509 2015-07-01 0.159129 0.233721 0.159129 0.188965 0.188965 28342530 2015-08-01 0.188965 0.243666 0.164102 0.203884 0.203884 43182669 2015-09-01 0.208857 0.288421 0.159129 0.174047 0.174047 110485197 2015-10-01 0.179020 0.203884 0.164102 0.169074 0.169074 32668199 2015-11-01 0.164102 0.169074 0.134265 0.134265 0.134265 17447817 2015-12-01 0.139238 0.164102 0.129292 0.134265 0.134265 14972015 2016-01-01 0.134265 0.144210 0.096472 0.119346 0.119346 20475692 2016-02-01 0.119346 0.179020 0.119346 0.144210 0.144210 19833892 Jul-12 Aug-12 Sep-12 Oct-12 Nov-12 Dec-12 Jan-13 Feb-13 Mar-13 Apr-13 May-13 Jun-13 Jul-13 Aug-13 Sep-13 Oct-13 Nov-13 Dec-13 Jan-14 Feb-14 Mar-14 Apr-14 May-14 Jun-14 Jul-14 Aug-14 Sep-14 Oct-14 Nov-14 Dec-14 Jan-15 Feb-15 Mar-15 Apr-15 May-15 Jun-15 Jul-15 Aug-15 Sep-15 Oct-15 Nov-15 Dec-15 Jan-16 Feb-16 Mar-16 Apr-16 May-16 Jun-16 Jul-16 Aug-16 Sep-16 Oct-16 Nov-16 Dec-16 Jan-17 Feb-17 Mar-17 Apr-17 May-17 Jun-17 Jul-17 Aug-17 Sep-17 Oct 17 0.2375 0.2618 0.2541 0.2485 0.2537 0.2651 0.2788 0.2869 0.2881 0.2665 0.2649 0.2903 0.3073 0.3161 0.3274 0.3250 0.3378 0.3466 0.3418 0.3370 0.3354 0.3298 0.3097 0.3032 0.2847 0.2798 0.2911 0.2725 0.2677 0.2434 0.2174 0.2060 0.2044 0.1986 0.2369 0.2450 0.2385 0.2239 0.2223 0.2158 0.2345 0.2345 0.2247 0.2044 0.2117 0.2076 0.1913 0.1750 0.1594 0.1553 0.1643 0.1815 0.2068 0.2296 0.2247 0.2263 0.2312 0.2109 0.2092 0.1986 0.2174 0.2141 0.2223 n 228A a) Collect the market price index (All Ordinaries), Share price for a company (as per instructions given in page 2) and display the data for two sub-periods (Period 1: March 2014 to February 2016; Period 2: February2018 to January 2020) separately in two separate tables. (2 marks) b) Calculate the return of share prices and market return (n) (from market price index). Display the calculated returns along with the risk free rate of return (given in a separate excel file) in a table for two sub periods. Calculate and tabulate, (-R) and (.-R.). (2 marks) c) Calculate the mean, standard deviation, variance and correlation coefficient for (-Rs) and (L-R) (-.-Ry) separately (for two sub-period in a table-see next page) and comment on the result. (2+2=4 marks, 2 for calculation 2 for the comment) d) Estimate beta for your selected company for the two sub-periods. (1+1=2 marks) e) Explain the value of beta that you have calculated. (1.5+1.5=3 marks-1.5 for each sub-period) f) Provide a brief description of the company. (2 marks) g) Why the estimated value of beta is different for two sub-periods? (2.5+2.5=5 marks) P.-PLY Where, r, - Return on Share Price for Company ) -X100% P. RE-Risk free rate of return (given: do not multiply by 100) (Monthly R, -1x100 100 r - Annual T-Bill rate P - Share Price at time 1. 2. Keep only Date and the Adi Close. This will be the share price for your selected firm. (Please ignore the dividend paid. That is, delete dividend for each period) Similarly, collect the data for the same period for All Ordinaries. This will be your market index. (convert the data from oldest to newest using "sort" or "filter") FVA - PMT (1+i) = PMT[(1+i) +(1+i)' +(1+i) + ... + (1+i)***] PMT[(1+i)" - 1] (using the formula from G.P.) divide the return (using = PMT X FVIFA, data for two sub-periods: Risk free monthly rate of interest (already expressed in %) is given below. (Please do not change this data). Set the date on monthly basis. (Ex Mar-15, April-18...) Final result shall be in 4 decimal places 3. 4. 5. 6. Date Open High Low Close Adj Close Volume 2014-02-01 0.040776 0.047738 0.036798 0.042765 0.042765 7466371 2014-03-01 0.042765 0.083542 0.038787 0.062657 0.062657 64301148 2014-04-01 0.063651 0.096472 0.062657 0.092493 0.092493 33171207 2014-05-01 0.093488 0.183993 0.093488 0.174047 0.174047 87526412 2014-06-01 0.179020 0.188965 0.134265 0.183993 0.183993 46527928 2014-07-01 0.203884 0.338149 0.169074 0.198911 0.198911 91707886 2014-08-01 0.183993 0.263557 0.183993 0.218802 0.218802 41308359 2014-09-01 0.223775 0.228748 0.149183 0.169074 0.169074 36719158 2014-10-01 0.169074 0.174047 0.093488 0.099455 0.099455 40439346 2014-11-01 0.099455 0.104428 0.080559 0.080559 0.080559 35609340 2014-12-01 0.081553 0.083542 0.070613 0.079564 0.079564 12366749 2015-01-01 0.079564 0.119346 0.079564 0.098461 0.098461 19797306 2015-02-01 0.096472 0.169074 0.095477 0.159129 0.159129 28448407 2015-03-01 0.154156 0.228748 0.149183 0.198911 0.198911 43010298 2015-04-01 0.198911 0.205873 0.139238 0.154156 0.154156 29427605 2015-05-01 0.159129 0.203884 0.149183 0.183993 0.183993 29595697 2015-06-01 0.179020 0.218802 0.139238 0.154156 0.154156 34985509 2015-07-01 0.159129 0.233721 0.159129 0.188965 0.188965 28342530 2015-08-01 0.188965 0.243666 0.164102 0.203884 0.203884 43182669 2015-09-01 0.208857 0.288421 0.159129 0.174047 0.174047 110485197 2015-10-01 0.179020 0.203884 0.164102 0.169074 0.169074 32668199 2015-11-01 0.164102 0.169074 0.134265 0.134265 0.134265 17447817 2015-12-01 0.139238 0.164102 0.129292 0.134265 0.134265 14972015 2016-01-01 0.134265 0.144210 0.096472 0.119346 0.119346 20475692 2016-02-01 0.119346 0.179020 0.119346 0.144210 0.144210 19833892 Jul-12 Aug-12 Sep-12 Oct-12 Nov-12 Dec-12 Jan-13 Feb-13 Mar-13 Apr-13 May-13 Jun-13 Jul-13 Aug-13 Sep-13 Oct-13 Nov-13 Dec-13 Jan-14 Feb-14 Mar-14 Apr-14 May-14 Jun-14 Jul-14 Aug-14 Sep-14 Oct-14 Nov-14 Dec-14 Jan-15 Feb-15 Mar-15 Apr-15 May-15 Jun-15 Jul-15 Aug-15 Sep-15 Oct-15 Nov-15 Dec-15 Jan-16 Feb-16 Mar-16 Apr-16 May-16 Jun-16 Jul-16 Aug-16 Sep-16 Oct-16 Nov-16 Dec-16 Jan-17 Feb-17 Mar-17 Apr-17 May-17 Jun-17 Jul-17 Aug-17 Sep-17 Oct 17 0.2375 0.2618 0.2541 0.2485 0.2537 0.2651 0.2788 0.2869 0.2881 0.2665 0.2649 0.2903 0.3073 0.3161 0.3274 0.3250 0.3378 0.3466 0.3418 0.3370 0.3354 0.3298 0.3097 0.3032 0.2847 0.2798 0.2911 0.2725 0.2677 0.2434 0.2174 0.2060 0.2044 0.1986 0.2369 0.2450 0.2385 0.2239 0.2223 0.2158 0.2345 0.2345 0.2247 0.2044 0.2117 0.2076 0.1913 0.1750 0.1594 0.1553 0.1643 0.1815 0.2068 0.2296 0.2247 0.2263 0.2312 0.2109 0.2092 0.1986 0.2174 0.2141 0.2223 n 228A