Answered step by step
Verified Expert Solution
Link Copied!

Question

1 Approved Answer

Company Name Social and Environmental Performance Score 2014 Social and Environmental Performance Score 2015 Company 1 57.34 44.39 Company 2 49.96 52.75 Company 3 30.55

Company Name Social and Environmental Performance Score 2014 Social and Environmental Performance Score 2015
Company 1 57.34 44.39
Company 2 49.96 52.75
Company 3 30.55 32.05
Company 4 49.61 49.94
Company 5 59.75 62.56
Company 6 56.81 63.05
Company 7 54.22 56.52
Company 8 56.67 59.95
Company 9 56.71 58.07
Company 10 61.06 63.14
Company 11 48.82 49.48
Company 12 62.66 61.51
Company 13 46.30 47.78
Company 14 54.12 50.51
Company 15 36.19 44.76
Company 16 53.52 53.38
Company 17 61.46 58.44
Company 18 58.32 59.30
Company 19 48.82 43.75
Company 20 55.08 48.54
Company 21 50.63 46.58
Company 22 57.57 61.95
Company 23 57.34 54.44
Company 24 60.03 56.13
Company 25 51.74 53.54
Company 26 58.77 59.41
Company 27 58.39 57.52
Company 28 55.65 58.55
Company 29 53.31 48.97
Company 30 58.85 61.01
Company 31 50.70 53.17
Company 32 56.07 50.01
Company 33 53.93 54.84
Company 34 55.60 53.91
Company 35 52.19 54.64
Company 36 56.34 53.26
Company 37 61.14 61.47
Company 38 47.42 60.25
Company 39 58.58 59.70
Company 40 56.56 54.08
Company 41 64.57 65.29
Company 42 49.73 50.28
Company 43 64.04 64.88
Company 44 48.25 45.31
Company 45 52.24 50.07
Company 46 60.10 60.58
Company 47 55.66 52.04
Company 48 47.56 47.74
Company 49 65.46 66.16
Company 50 61.18 60.17

image text in transcribed

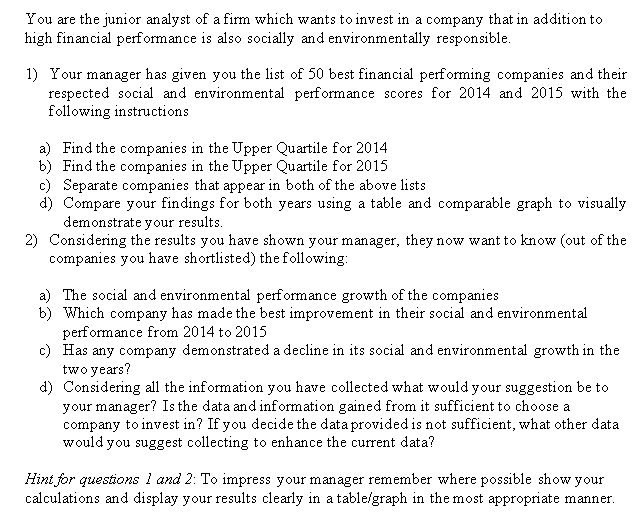
You are the junior analyst of a firm which wants to invest in a company that in addition to high financial performance is also socially and environmentally responsible. 1) Your manager has given you the list of 50 best financial performing companies and their respected social and environmental performance scores for 2014 and 2015 with the following instructions a) Find the companies in the Upper Quartile for 2014 b) Find the companies in the Upper Quartile for 2015 c) Separate companies that appear in both of the above lists d) Compare your findings for both years using a table and comparable graph to visually demonstrate your results. 2) Considering the results you have shown your manager, they now want to know (out of the companies you have shortlisted) the following: a) The social and environmental performance growth of the companies b) Which company has made the best improvement in their social and environmental performance from 2014 to 2015 c) Has any company demonstrated a decline in its social and environmental growth in the two years? d) Considering all the information you have collected what would your suggestion be to your manager? Is the data and information gained from it sufficient to choose a company to invest in? If you decide the data provided is not sufficient, what other data would you suggest collecting to enhance the current data? Hint for questions 1 and 2: To impress your manager remember where possible show your calculations and display your results clearly in a table/graph in the most appropriate manner. You are the junior analyst of a firm which wants to invest in a company that in addition to high financial performance is also socially and environmentally responsible. 1) Your manager has given you the list of 50 best financial performing companies and their respected social and environmental performance scores for 2014 and 2015 with the following instructions a) Find the companies in the Upper Quartile for 2014 b) Find the companies in the Upper Quartile for 2015 c) Separate companies that appear in both of the above lists d) Compare your findings for both years using a table and comparable graph to visually demonstrate your results. 2) Considering the results you have shown your manager, they now want to know (out of the companies you have shortlisted) the following: a) The social and environmental performance growth of the companies b) Which company has made the best improvement in their social and environmental performance from 2014 to 2015 c) Has any company demonstrated a decline in its social and environmental growth in the two years? d) Considering all the information you have collected what would your suggestion be to your manager? Is the data and information gained from it sufficient to choose a company to invest in? If you decide the data provided is not sufficient, what other data would you suggest collecting to enhance the current data? Hint for questions 1 and 2: To impress your manager remember where possible show your calculations and display your results clearly in a table/graph in the most appropriate manner

Step by Step Solution

There are 3 Steps involved in it

Step: 1

blur-text-image

Get Instant Access to Expert-Tailored Solutions

See step-by-step solutions with expert insights and AI powered tools for academic success

Step: 2

blur-text-image

Step: 3

blur-text-image

Ace Your Homework with AI

Get the answers you need in no time with our AI-driven, step-by-step assistance

Get Started

Recommended Textbook for

Financing For Gender Equality Realising Womens Rights Through Gender Responsive Budgeting

Authors: Zohra Khan , Nalini Burn

1st Edition

1137461004, 1137461012, 9781137461001, 9781137461018

More Books

Students also viewed these Accounting questions

Question

u = 5 j , v = 6 i Find the angle between the vectors.

Answered: 1 week ago