

Question
Company: PG years: 2022, 2021, 2020 (unless it has to be starting 2021, 2020, 2019). problem: 1) Using an Excel spreadsheet, you will create a
Company: PG
years: 2022, 2021, 2020 (unless it has to be starting 2021, 2020, 2019).
problem:
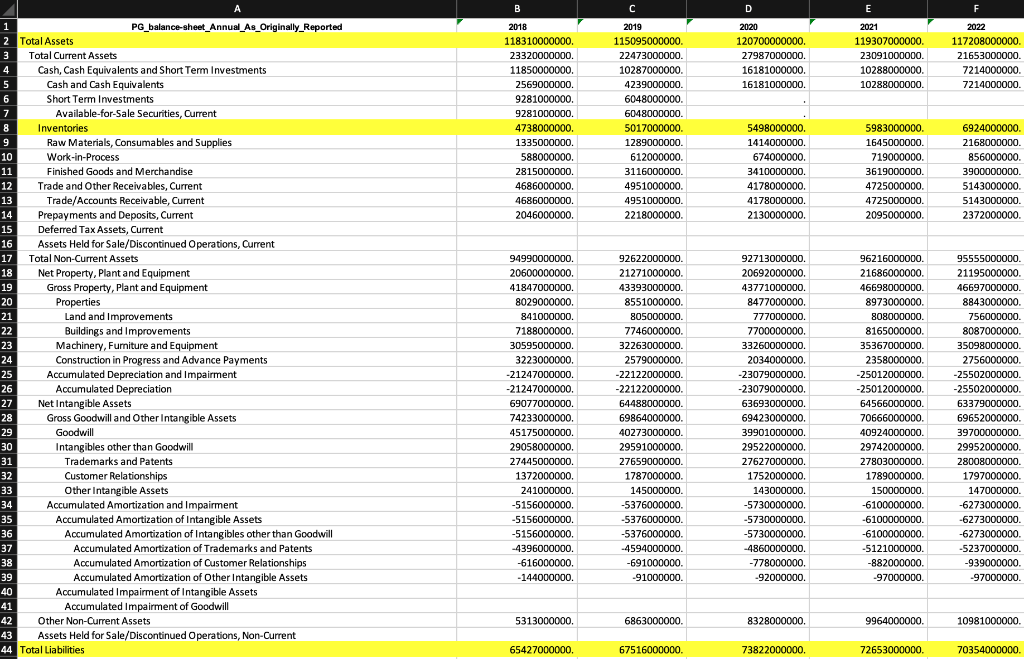
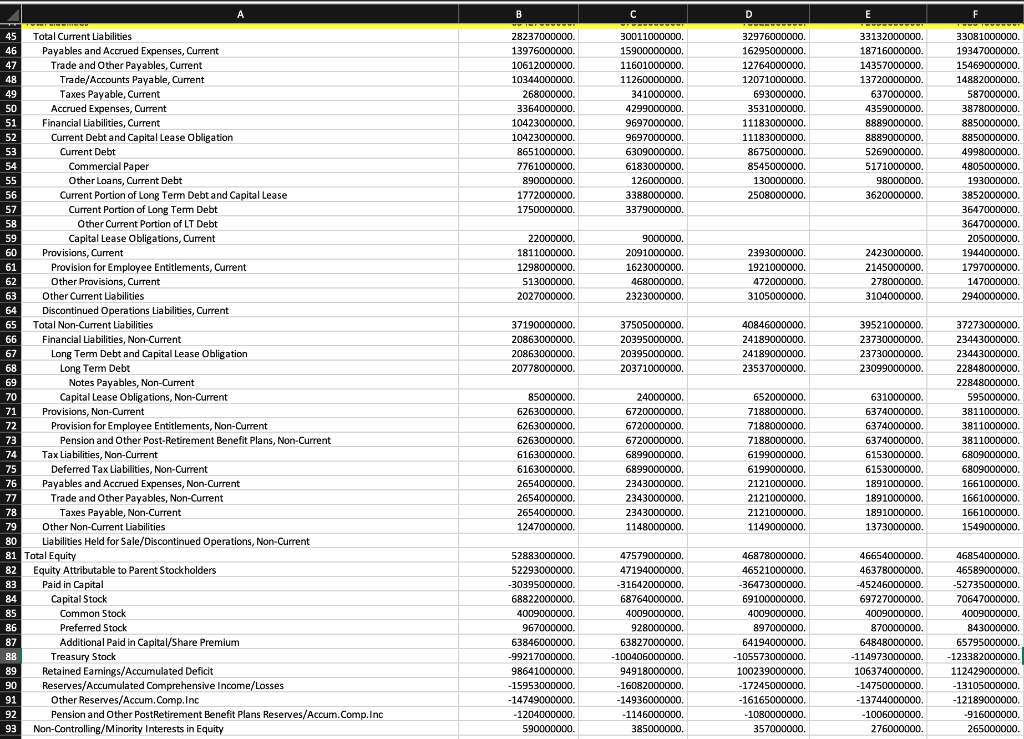
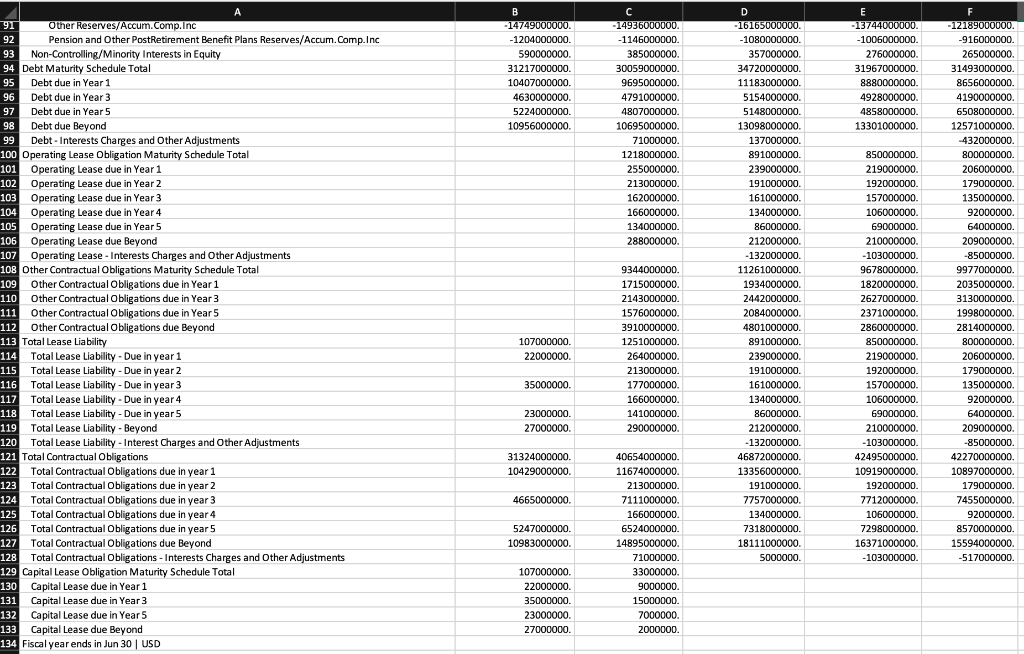
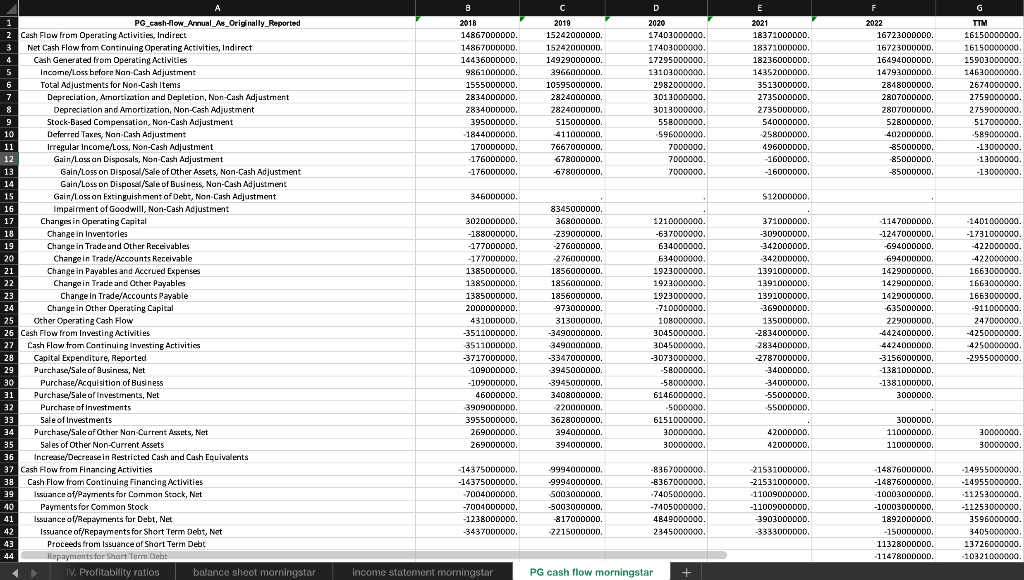
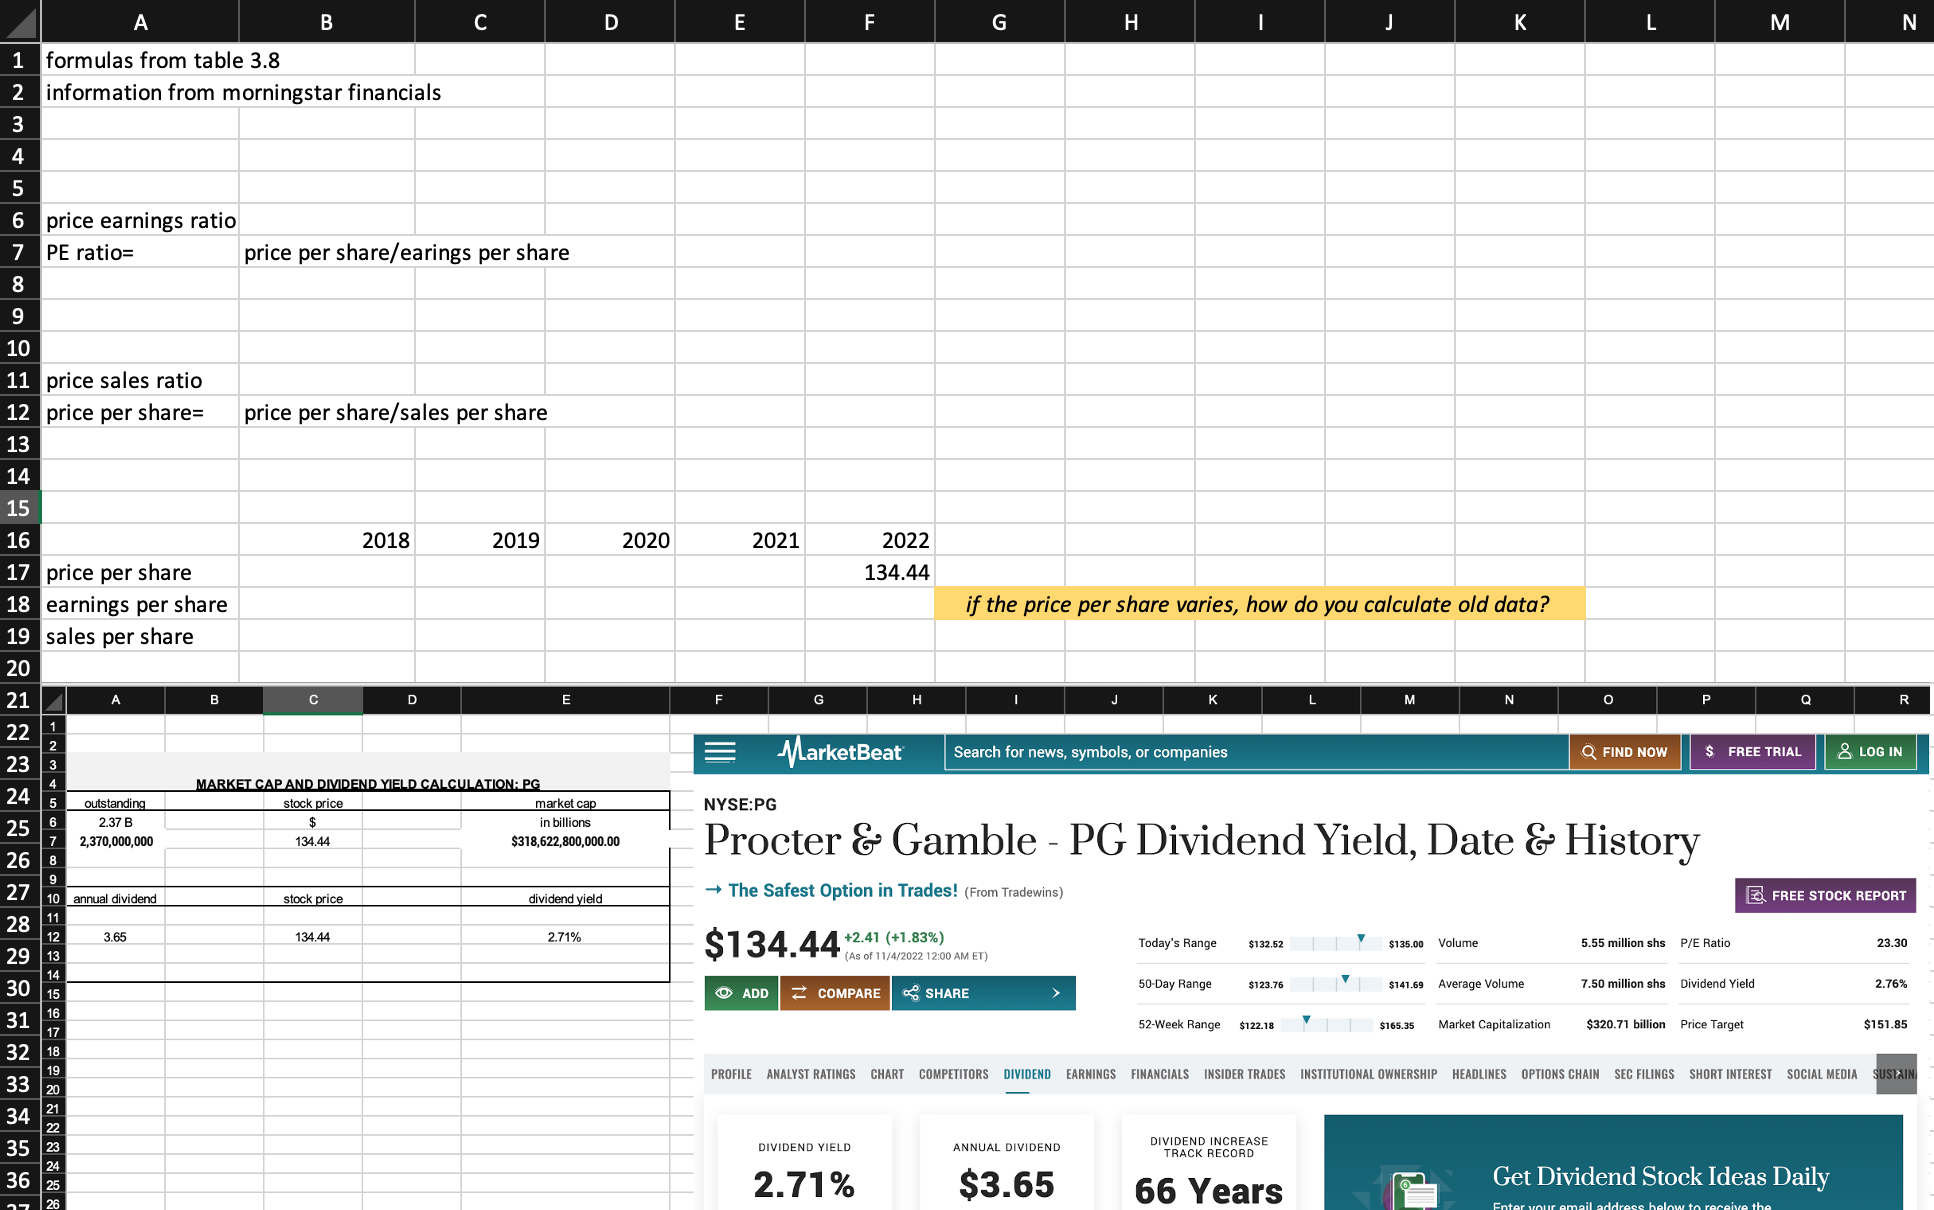
1) Using an Excel spreadsheet, you will create a three-year ratio trend analysis from the financial statements for your assigned corporation. The trend will consist of the following ratios:
Current Ratio and the Quick Ratio from the I. Short term solvency, or liquidity, ratios category
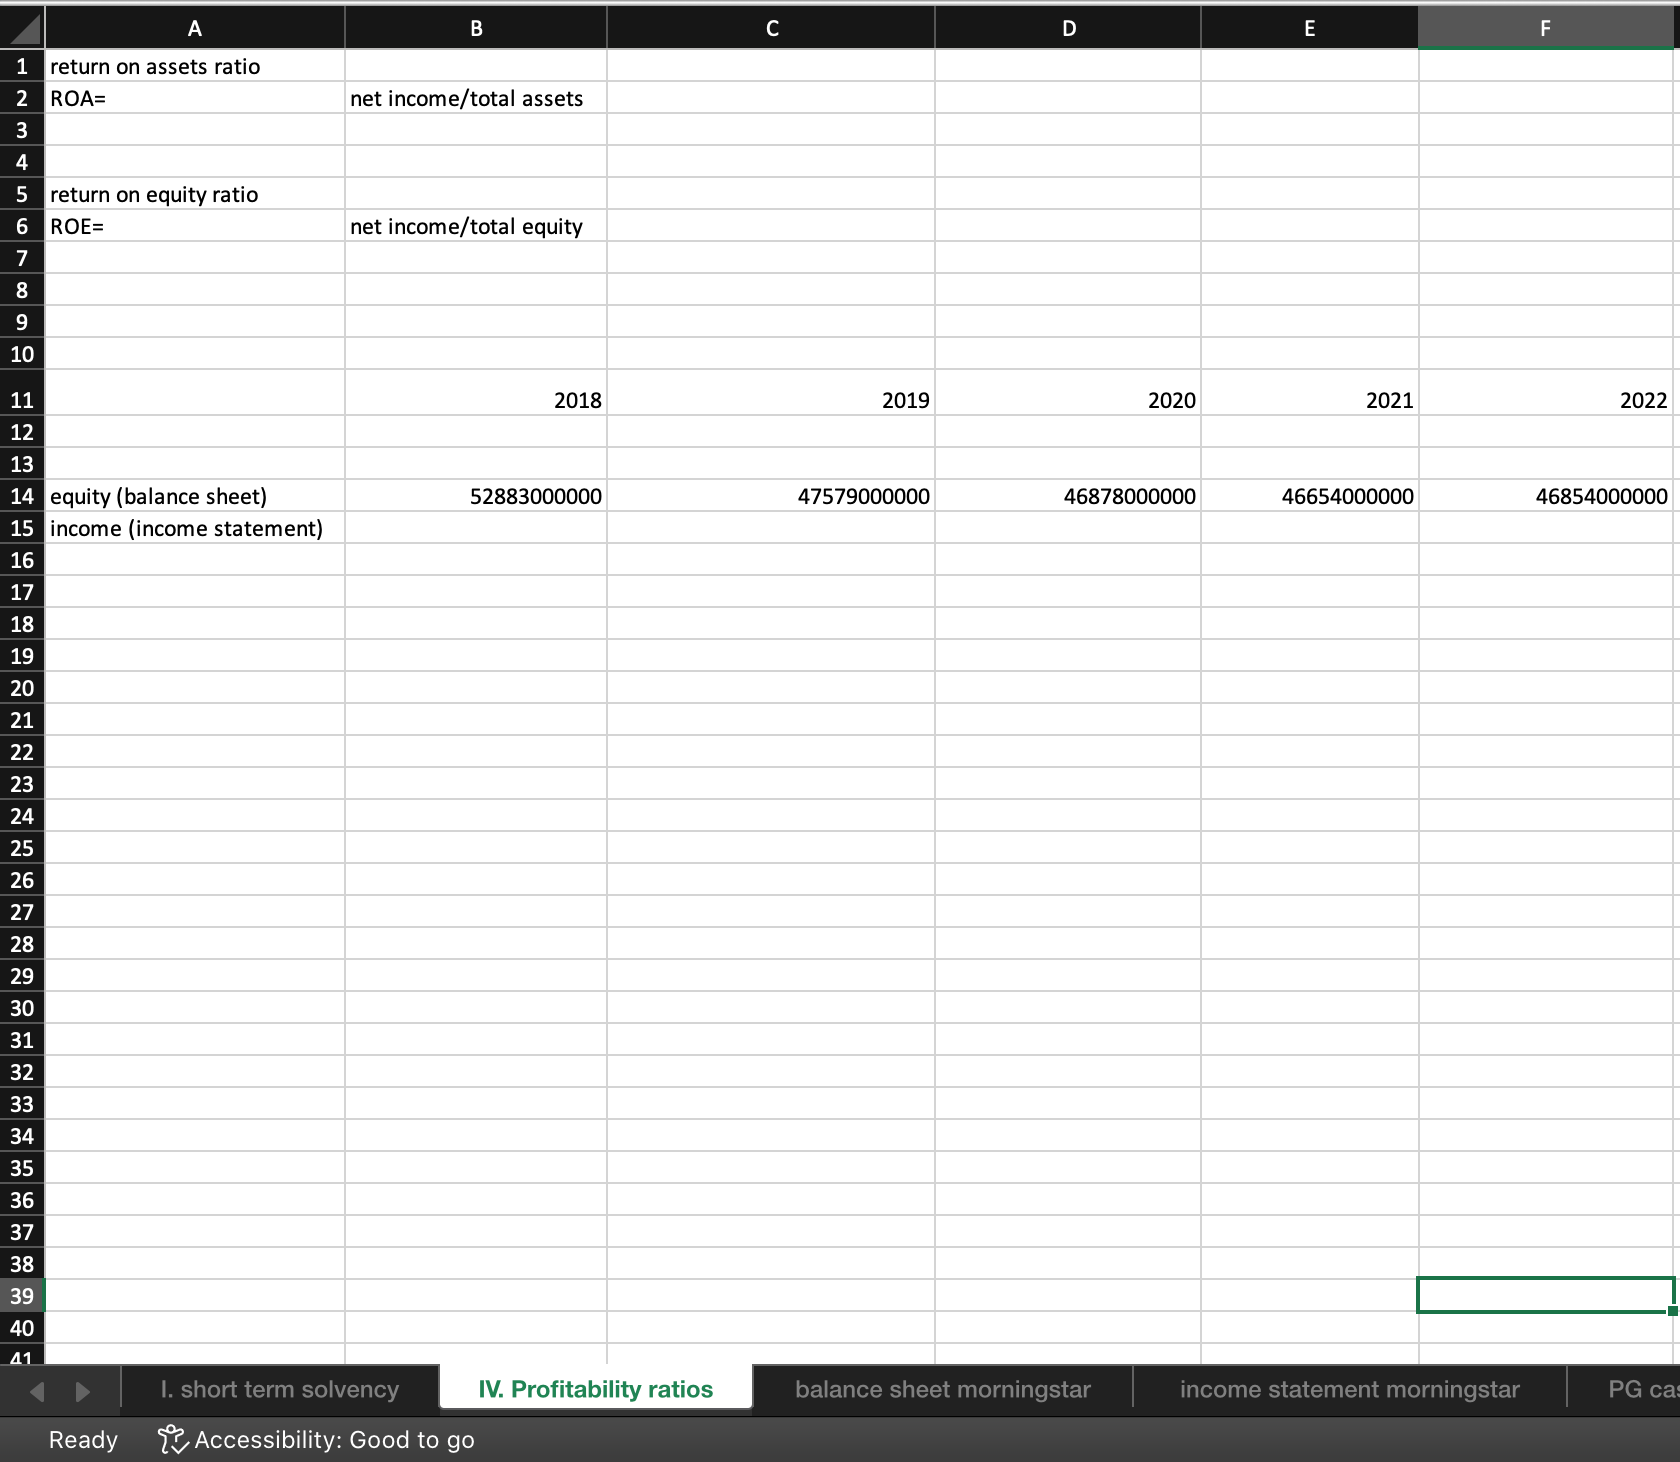
Return on Assets Ratio and the Return on Equity Ratio from the IV. Profitability ratios category
Price Earnings Ratio and the Price Sales Ratio from the V. Market value ratios category.
Then provide a one-page (minimum) discussion about what each trend indicates for your assigned corporation. Is the trend good or bad, why?
PG balance sheet from morningstar
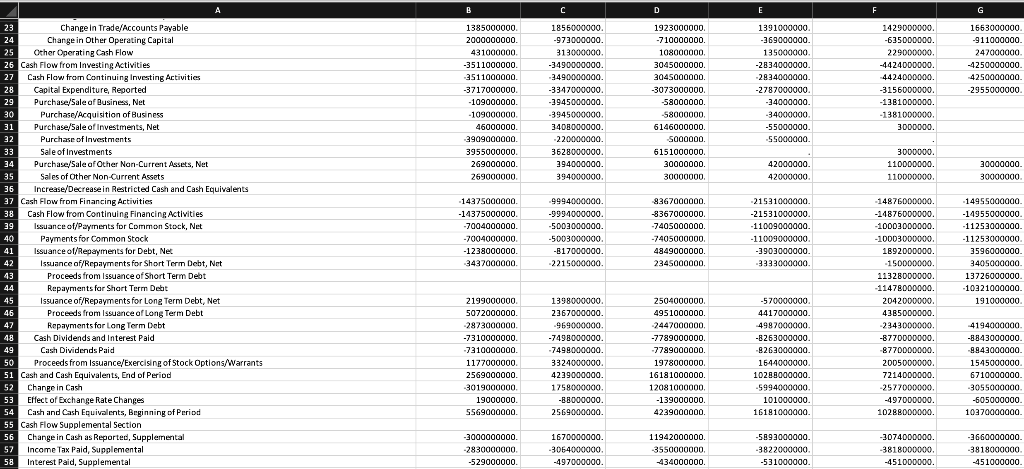
PG cash flow annual from morningstar
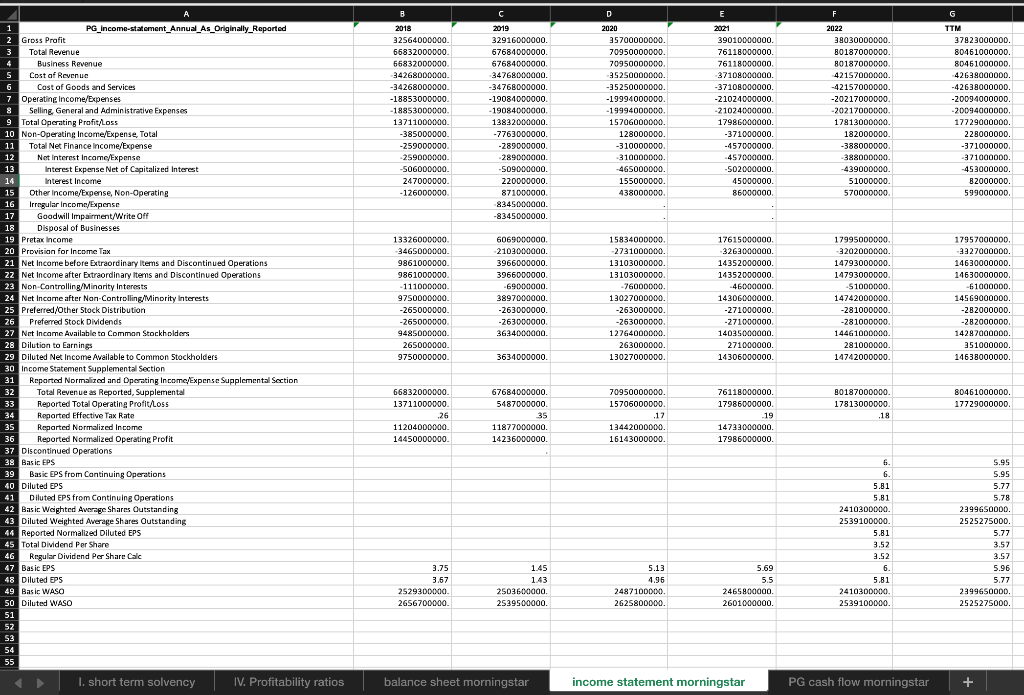
PG income statement from morningstar
Work:
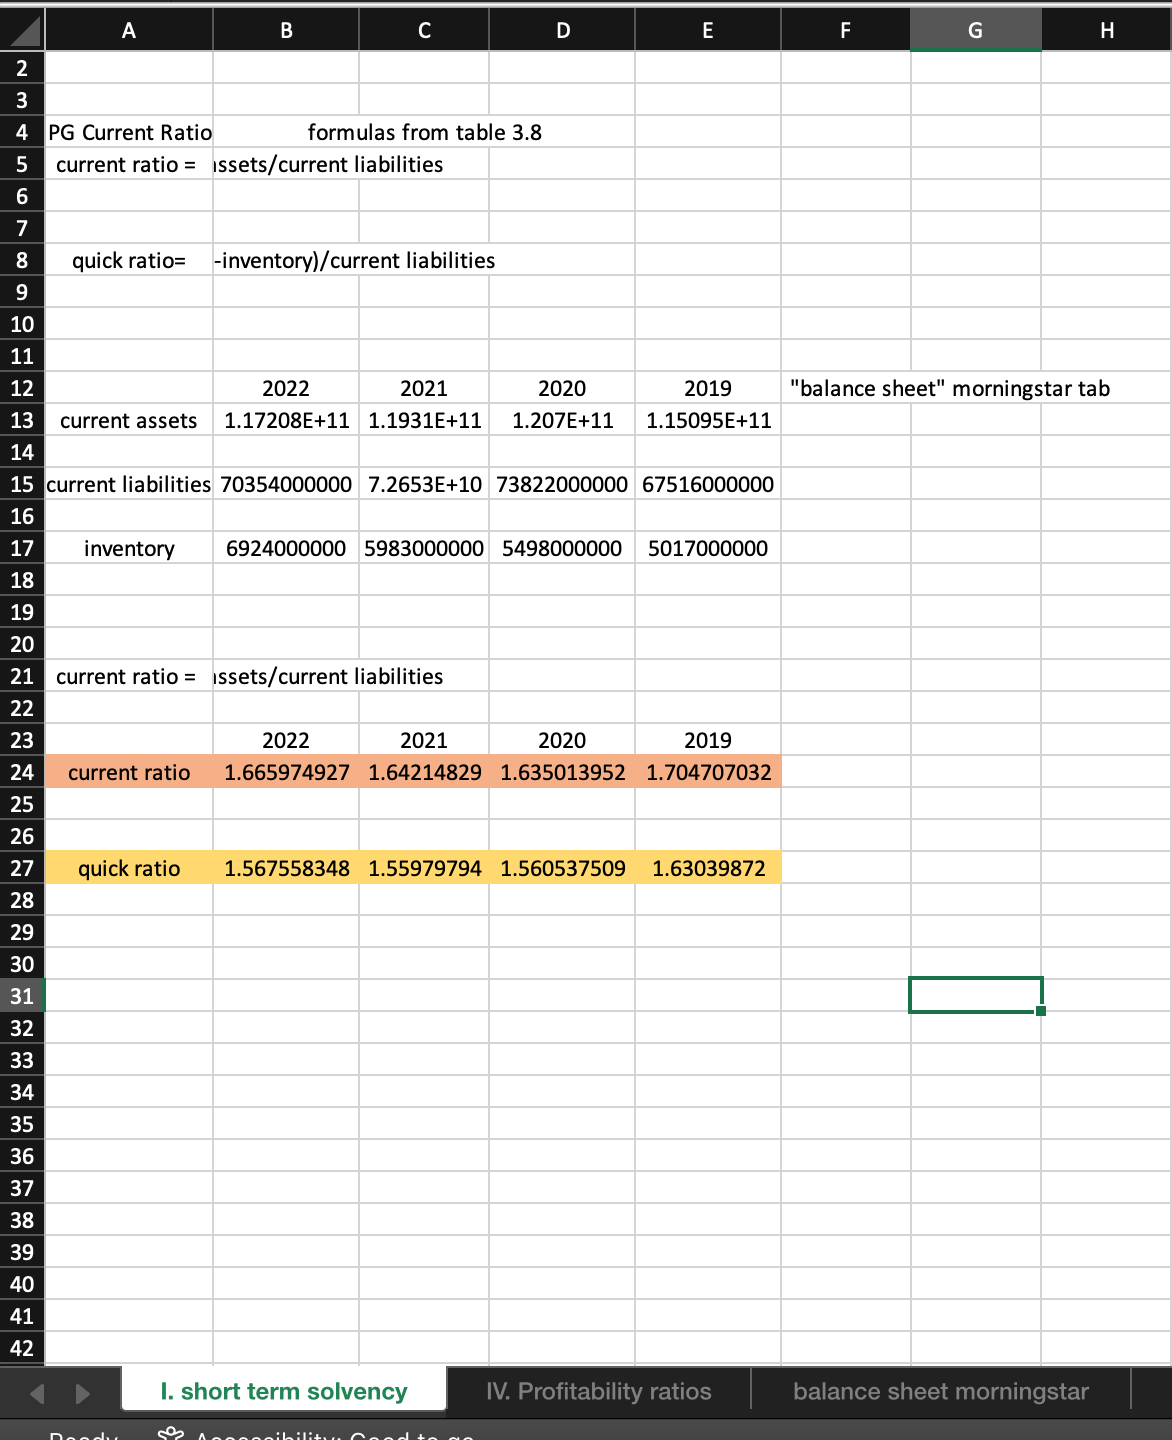 I believe this is right above
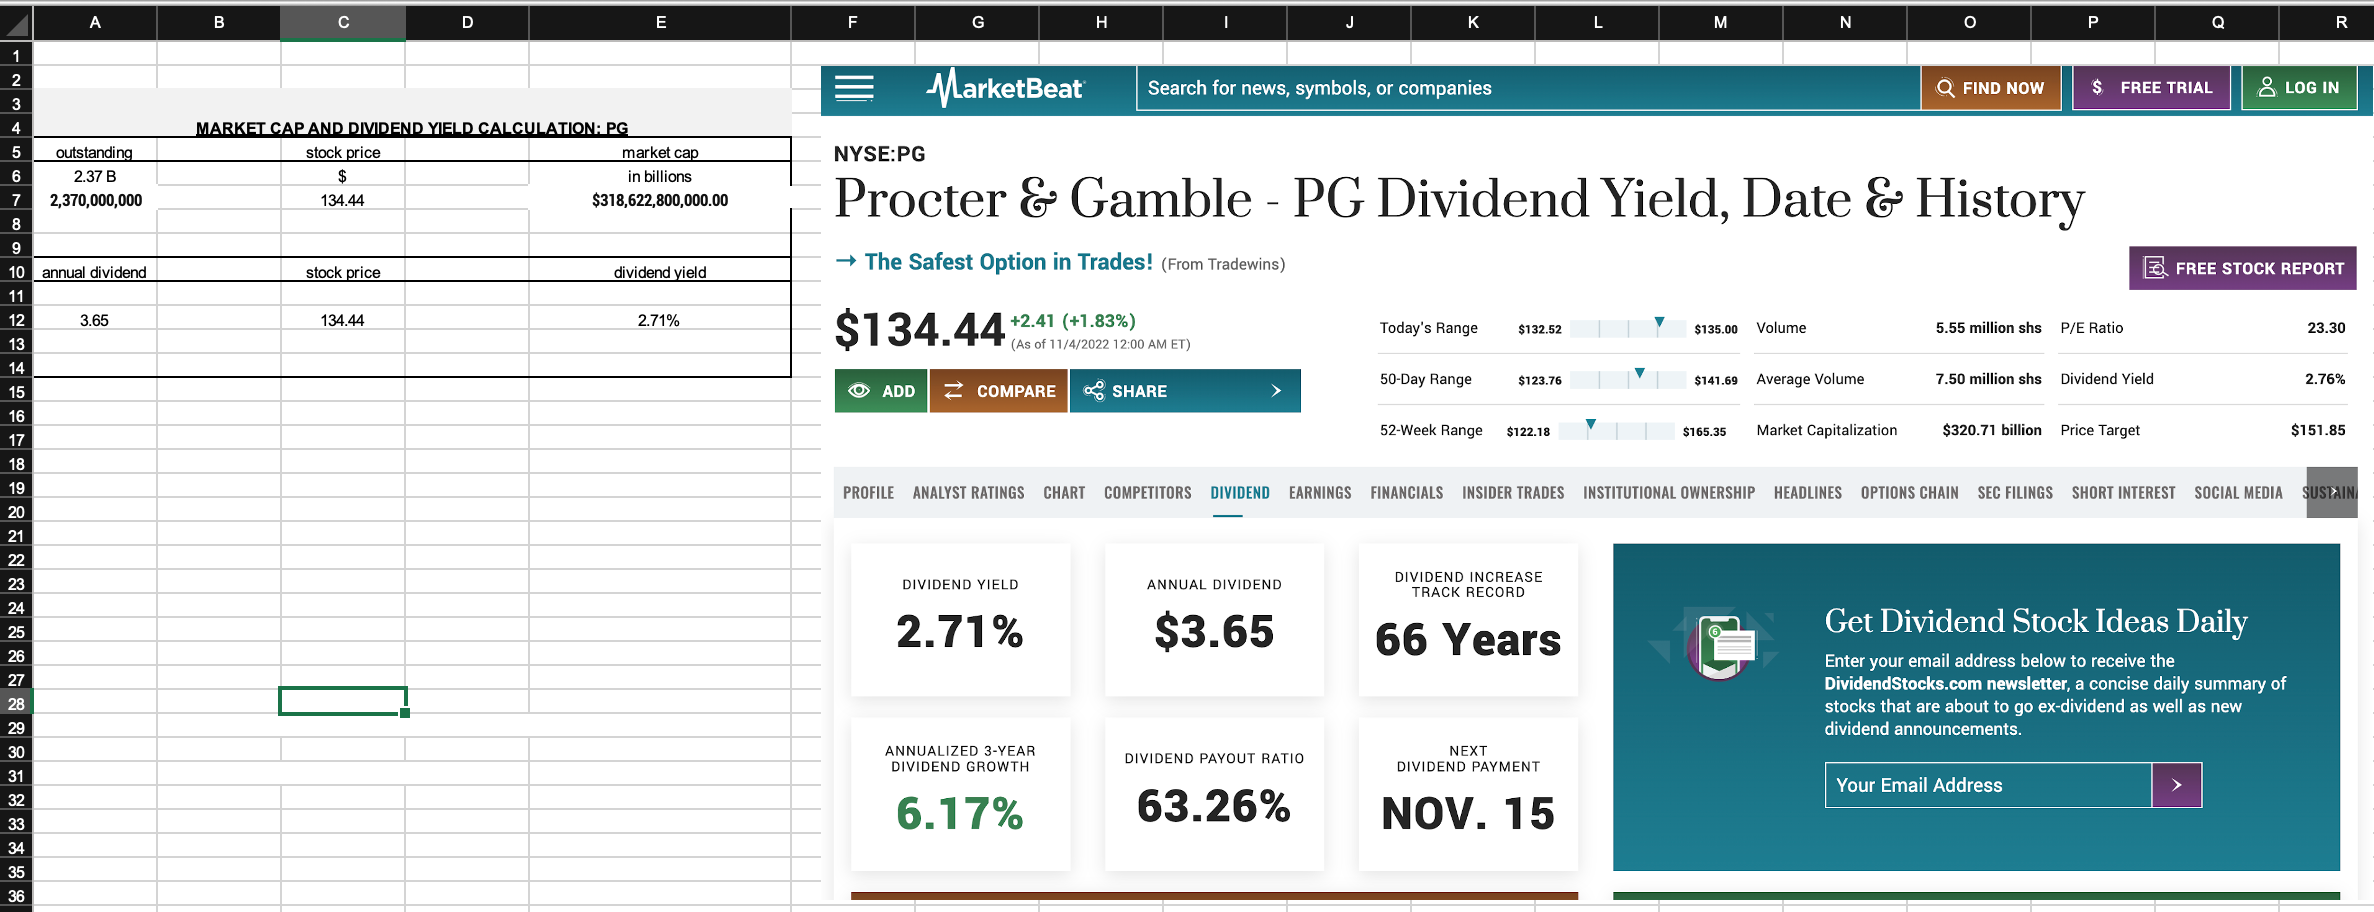
this part I'm not sure about
this part I'm not sure. How would you calculate the price per share since the 134.44 isn't accurate for 2021,2020 or any other year?( i included it for the stock price from market beat)
 thanks! I can repost additionally if needed. Just wanted to make sure I'm on the right track with short term solvency tab. the two problems below it I'm not sure about. thank you!
Step by Step Solution
There are 3 Steps involved in it
Step: 1

Get Instant Access to Expert-Tailored Solutions
See step-by-step solutions with expert insights and AI powered tools for academic success
Step: 2

Step: 3
Ace Your Homework with AI
Get the answers you need in no time with our AI-driven, step-by-step assistance
Get Started
Financial Valuation Workbook
Authors: James Hitchner, Michael J. Mard
1st Edition
0471220833, 978-0471220831