

Answered step by step
Verified Expert Solution
Question
1 Approved Answer
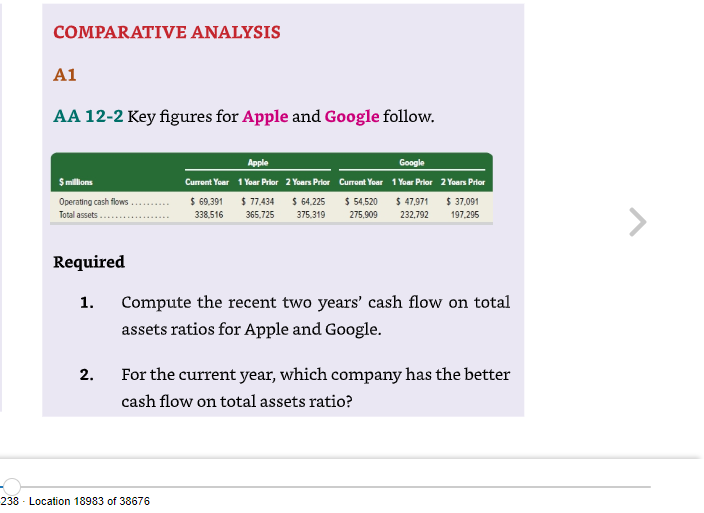
COMPARATIVE ANALYSIS A1 AA 12-2 Key figures for Apple and Google follow. $ millones Operating cash flows Total assets Apple Google Current Your 1 Year
Step by Step Solution
There are 3 Steps involved in it
Step: 1

Get Instant Access to Expert-Tailored Solutions
See step-by-step solutions with expert insights and AI powered tools for academic success
Step: 2

Step: 3
Ace Your Homework with AI
Get the answers you need in no time with our AI-driven, step-by-step assistance
Get Started
The Accounts Receivable Blueprint Unlocking Financial Success With Proven Strategies
Authors: Simon Udeh Andrew
979-8399614939