Comparative Analysis Problem: PepsiCo, Inc. vs. The Coca-Cola Company
CT12-2.
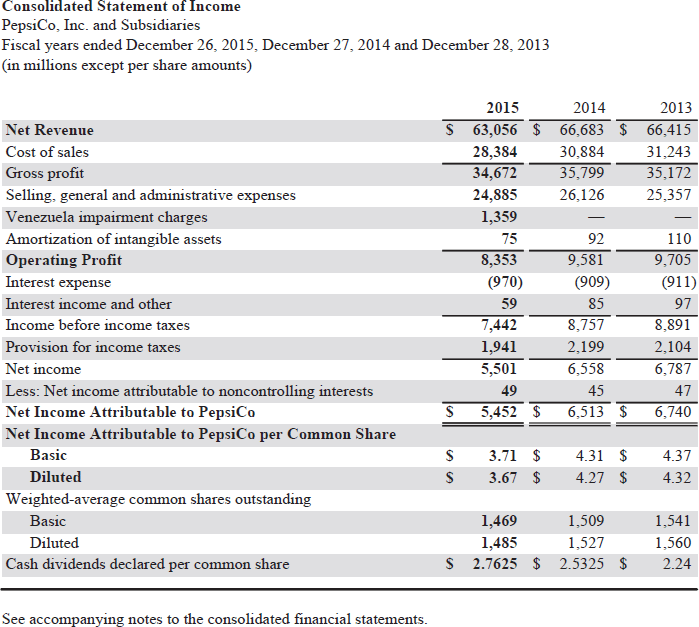
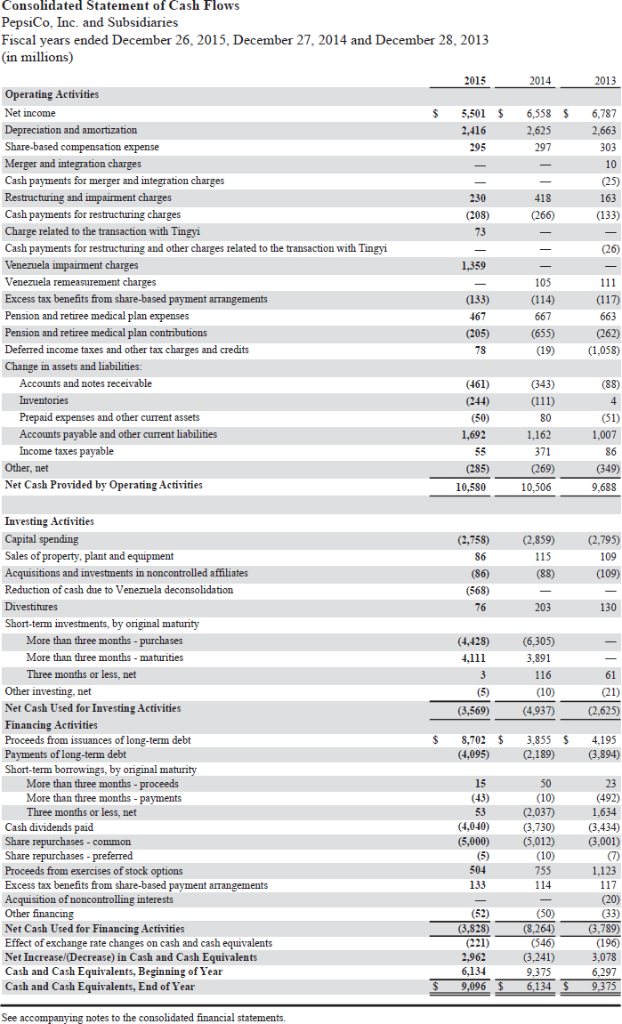
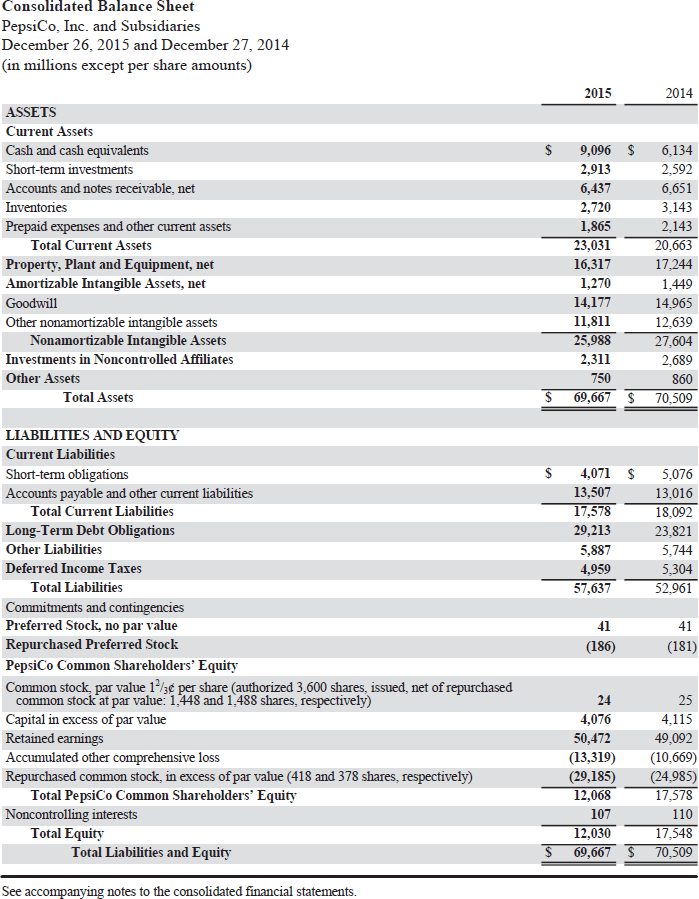
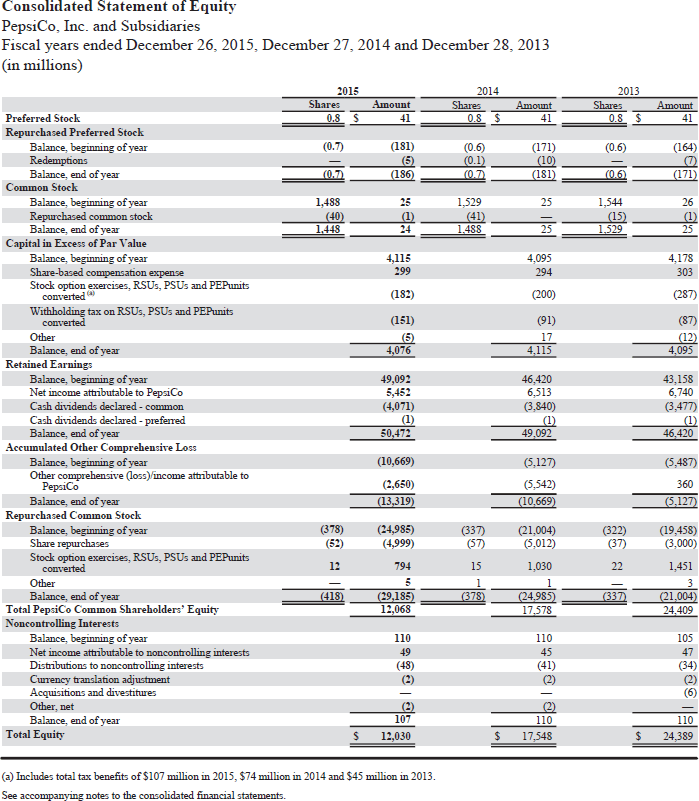
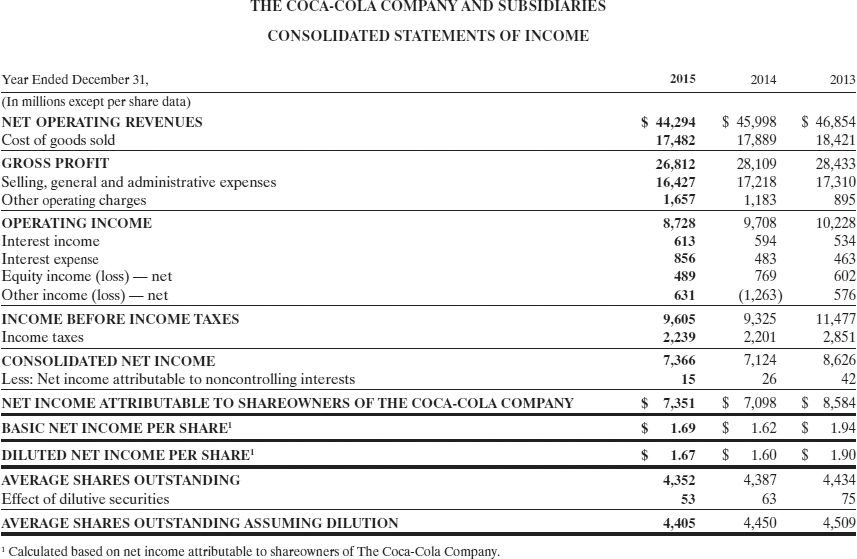
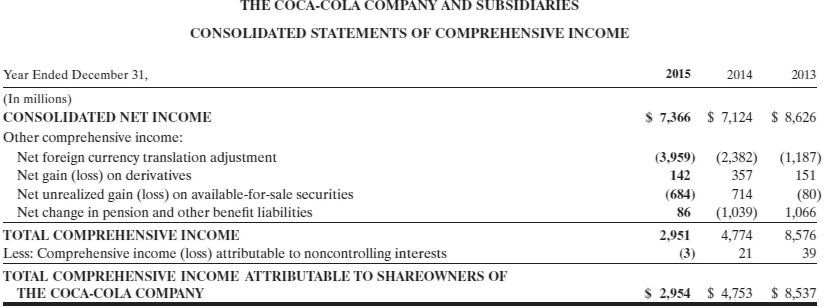
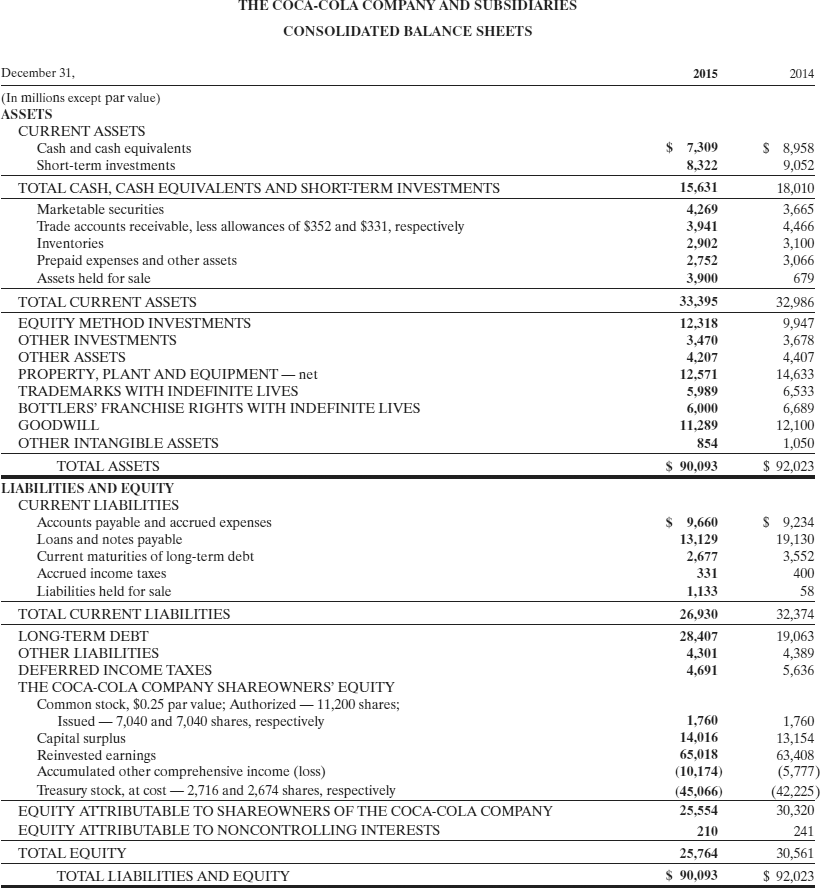
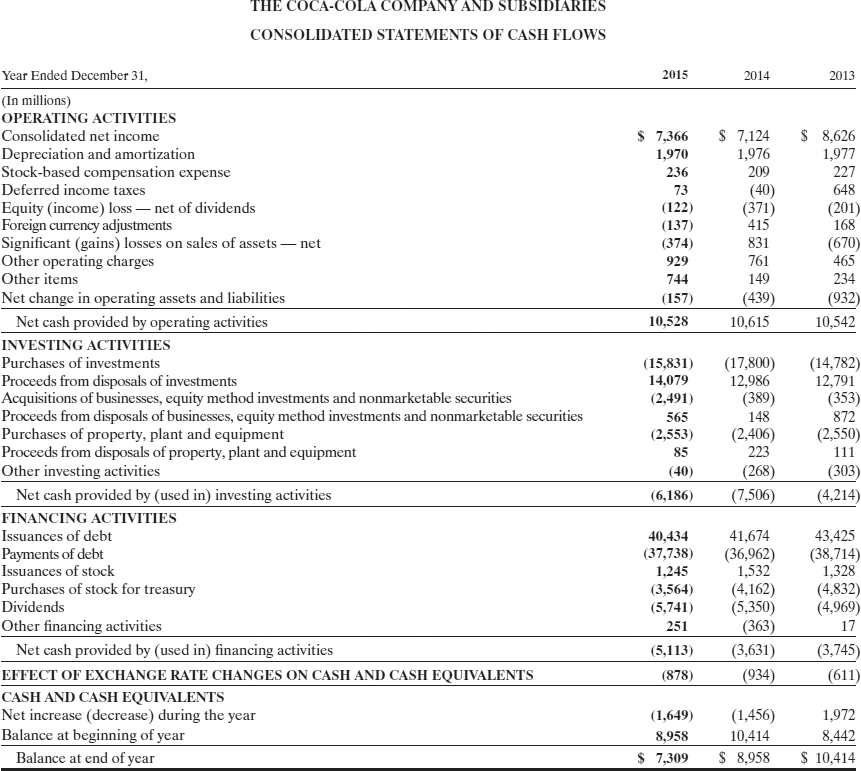
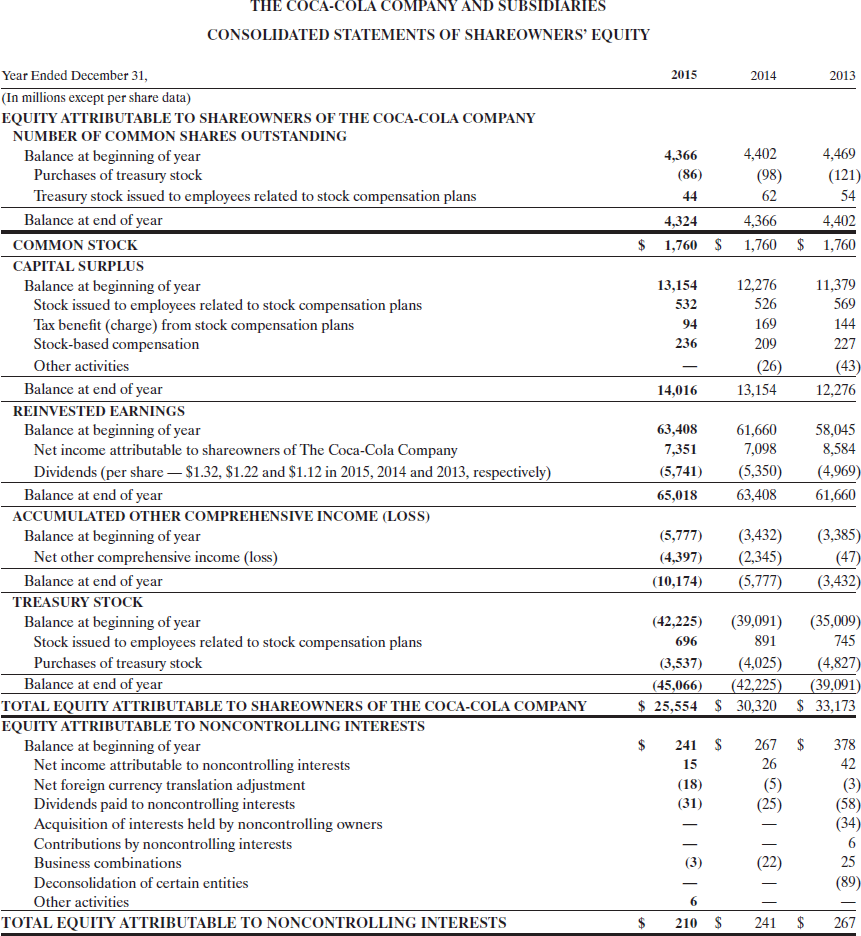
PepsiCo's financial statements are presented in Appendix B. Financial statements of The Coca-Cola Company are presented in Appendix C. Instructions for accessing and using the complete annual reports of PepsiCo and Coca-Cola, including the notes to the financial statements, are also provided in Appendices B and C, respectively.
Instructions
(a)
Based on the information contained in these financial statements, compute free cash flow for each company.
(b)
What conclusions concerning the management of cash can be drawn from these data?
Thanks!!!
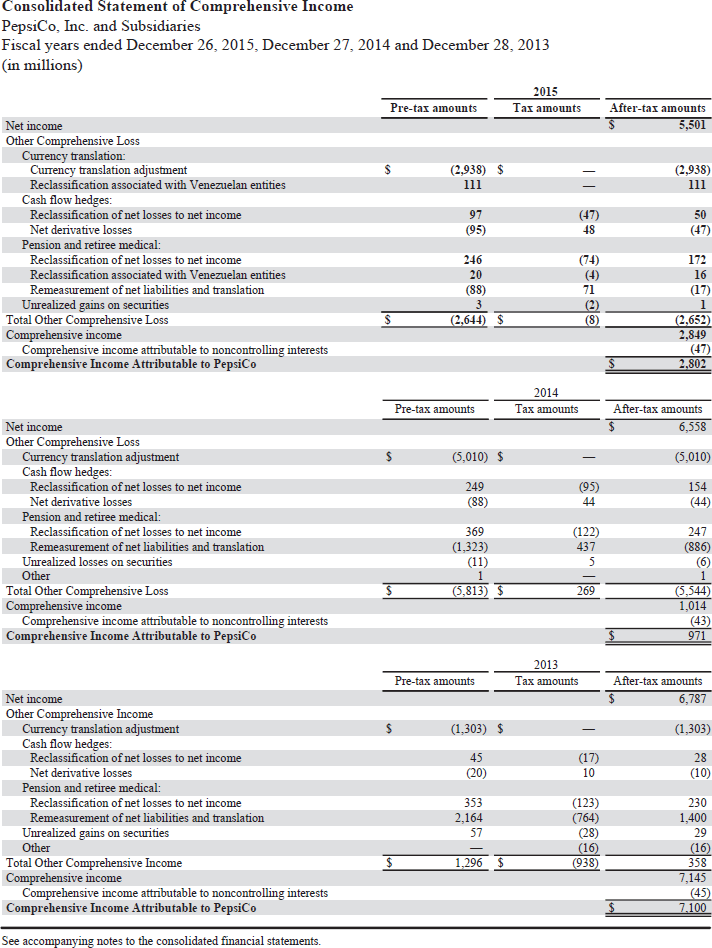
Consolidated Statement of Comprehensive Income PepsiCo. Inc. and Subsidiaries Fiscal years ended December 26, 2015, December 27, 2014 and December 28, 2013 (in millions) Pre-tax amounts After-tax amounts 5,501 ax ainounts ncom Other Comprehensive Loss Currency translation adjustment Reclassification associated with Venezuelan entities (2,938) $ (2,938) Cash flow hedges: Reclassification of net losses to net income Net derivative losses 50 (47) 48 Pension and retiree medical: Reclassification of net losses to net income Reclassification associated with Venezuelan entities Remeasurement of net liabilities and translation 246 (74) 16 17) Unrealized gains on secrities Total Other Comprehensive Loss 2,849 ncome Compre Comprehensive Income Attributable to PepsiCo hensive income attributable to noncontrolling interests 2014 Tax amounts Pre-tax amounts After-tax amounts 6,558 (5,010) Net income Other Comprehensive Loss (5,010) $ y translation adjustment Cash flow hedges: 249 (88) Reclassification of net losses to net income Net derivative losses (95) Pension and retiree medical: 369 (1,323) (122) 437 247 Reclassification of net losses to net income Remeasurement of net liabilities and translation Unrealized losses on securities Total Other Comprehensive Loss 5,813 269 5,544 ncome Comprehensive income attributable to noncontrolling interests Comprehensive Income Attributable to PepsiCo 2013 Tax amounts Pre-tax amounts After-tax amounts Net income Other Comprehensive Income 6,787 Currency translation adjustment Cash flow hedges: (1,303) $ (1,303) 28 (10) Reclassification of net losses to net income Net derivative losses (20) Pension and retiree medical: 353 2,164 (123) Reclassification of net losses to net income Remeasurement of net liabilities and translation 230 1,400 29 (764) (28) Unrealized gains on securities Other Total Other Comprehensive Income 938 1,145 Comprehensive income attributable to noncontrolling interests Comprehensive Income Attributable to PepsiCo See accompanying notes to the consolidated financial statements. Operating Activities 2,625 2,416 Merger and integration charges 230 163 Charge related to the transaction with Tingyi 1,359 Excess tax benefits from share-based payment arrangements (133) (117) Pension and retiree medical plan contributions (655) 3l5 Change in assets and liabilities: HaD (244) 1,692 1,162 1,007 (285) Other, net 269) (349 Capital spending (2,795 T1S (88) (86) (109 Divestitures 130 More than three months - purchases (4,428) (6,305) Three months or less, net Net Cash Used for Investing Activities Financing Activities Pavments oflong-term debt More than three months proceeds 15 50 23 Three months or less, net Proceeds from exercises of stock options Acquisition of noncontrolling interests Net Cash Used for Financing Activities Net Increase/(Decrease) in Cash and Cash Equivalents Cash and Cash Equivalents, End of Yea 504 962 (3,241) $ 9,096 $6,134 9,37 Consolidated Balance Sheet PepsiCo. Inc. and Subsidiaries December 26, 2015 and December 27, 2014 (in millions except per share amounts) 2015 2014 ASSETS Current Assets Cash and cash equivalents Short-term investments Accounts and notes receivable, net $ 9,096 S6,134 2,592 6,651 3,143 2,143 20,663 17,244 1,449 14,965 12,639 27,604 2,689 860 69,667 70,509 2,913 6,437 2,720 1,865 23,031 16,317 1,270 14,177 11,811 25,988 2,311 750 Prepaid expenses and other current assets Total Current Assets Property, Plant and Equipment, net Amortizable Intangible Assets, net Goodwil1 Other nonamortizable intangible assets Nonamortizable Intangible Assets Investments in Noncontrolled Affiliates Other Assets Total Assets LIABILITIES AND EQUITY Current Liabilities Short-term obligations Accounts payable and other current liabilities S 4,071 5,076 13,016 18,092 23,821 5,744 5,304 52,961 13,507 17,578 29,213 5,887 4,959 57,637 Total Current Liabilities Long-Tem Debt Obligations Other Liabilities Deferred Income Tares Total Liabilities Commitments and contingencies Preferred Stock, no par value Repurchased Preferred Stock PepsiCo Common Shareholders' Equity Common stock par value 1/ae per share (authorized 3,600 shares, issued, net of repurchased (186) 25 common stock at par value: 1,448 and 1,488 shares, respectively) Capital in excess of par value Retained earnings Accumulated other comprehensive loss Repurchased common stock, in excess of par value (418 and 378 shares, respectively) 24 4,076 50,472 49,092 (13,319) (10,669) (29,185) (24,985) 17,578 Total PepsiCo Common Shareholders' Equity 12,068 107 12,030 Noncontrolling interests 17,548 69,667 $ 70,509 Total Equity Total Liabilities and Equity See accompanying notes to the consolidated financial statements. Consolidated Statement of Equity PepsiCo. Inc. and Subsidiaries Fiscal years ended December 26, 2015, December 27, 2014 and December 28, 2013 (in millions) 2014 Shares Preferred Stock Repurchased Preferred Stock 0.8 S (0.7) Balance, beginning of year Balance, end of year Balance, beginning of year Balance, end of year Balance, beginning of year Stock option exercises, RSUs, PSUs and PEPunits (181) (171) 0.6) (164) Common Stock 1,488 1,529 1,544 common stock Capital in Excess of Par Value 4,115 299 4.095 converted Withholding tax on RSUs, PSUs and PEPunits (91) 4.115 46,420 (3,840) (151) Balance, end of year 4.095 Retained Earnings Balance, beginning of year Net income attibutable to PepsiCo Cash dividends declared-common Cash dividends declared preferred Balance, end of year 49,092 5,452 (4,071) 43,158 6,740 (3,477) 50,472 Accumulated Other Comprehensive Loss (10,669) (2,650) Balance, beginning of year Other comprehensive (loss)income attributable to (5,487) (5,542) Balance, end of year Repurchased Coininon Stock Balance, beginning of year Share repurchases (378) (24,985) (4,999) (337) (57) (21,004) (5,012) 1,030 (322) (37) (19,458) 3,000) option exercises, RSUs, PSUs and PEPunits 21.004 Balance, end of year Total PepsiCo Common Shareholders' Equity Noncontrolling Interests 12,068 110 (48) 24.409 105 (34) 110 Balance, beginning of year Net income attributable to (41) Other, net Balance, end of year Total Equity $ 17,548 $ 24,389 S 12.030 (a) Includes total tax benefits of $107 million in 2015, $74 million in 2014 and $45 million in 2013 See accompanying notes to the consolidated financial statements. THE COCA-COLA COMPANY AND SUBSIDIARIES CONSOLIDATED STATEMENTS OF INCOME Year Ended December 31, (In millions except per share data) NET OPERATING REVENUES Cost of goods sold GROSS PROFIT Selling, general and administrative expenses Other operating charges OPERATING INCOME Interest income Interest expense Equity income (loss)-net Other income (loss)net 2015 2014 2013 44,294 45,998 46,854 18,421 28,10928,433 17,218 17,310 895 9,70810,228 534 463 602 576 9,325 11,477 2,851 8,626 42 17,482 26,812 16,427 1,657 8,728 613 856 489 631 9,605 2,239 7,366 15 17,889 1,183 594 483 769 1,263 INCOME BEFORE INCOME TAXES Income taxes CONSOLIDATED NET INCOME Less: Net income attributable to noncontrolling interests NET INCOME ATTRIBUTABLE TO SHAREOWNERS OF THE COCA-COLA COMPANY 2,201 7,124 26 7,357,098 S 8,584 1.69 1.62 1.94 1.671.60 1.90 4,387 BASIC NET INCOME PER SHARE DILUTED NET INCOME PER SHARE 4,434 75 4,509 AVERAGE SHARES OUTSTANDING Effect of dilutive securities AVERAGE SHARES OUTSTANDING ASSUMING DILUTION 4,352 53 63 4,450 4,405 Calculated based on net income attributable to shareowners of The Coca-Cola Company THE COCA-COLA COMPANY AND SUBSIDIARIES CONSOLIDATED STATEMENTS OF COMPREHENSIVE INCOME 2015 Year Ended December 31, (In millions) CONSOLIDATED NET INCOME Other comprehensive income 2014 2013 $ 7,366 S 7,124 8,626 Net foreign currency translation adjustment Net gain (loss) on derivatives Net unrealized gain (loss) on available-for-sale securities Net change in pension and other benefit liabilities 3,959) (2,382) (1,187) 357 714 86 (1,039) ,066 2,951 4,774 8,576 21 142 (684) 151 TOTAL COMPREHENSIVE INCOME Less: Comprehensive income (loss) attributable to noncontrolling interests TOTAL COMPREHENSIVE INCOME ATTRIBUTABLE TO SHAREOWNERS OF 39 2,954 4,753 8,5317 THE COCA-COLA COMPANY THE COCA-COLA COMPANY AND SUBSIDIARIES CONSOLIDATED BALANCE SHEETS December 31 2015 2014 (In millions except par value) ASSETS CURRENT ASSETS $ 7,309 8.322 Cash and cash equivalents Short-term investments S 8,958 9,052 18,010 3,665 4,466 5,631 4,269 3.941 2,902 2.752 3,900 33,395 TOTAL CASH, CASH EQUIVALENTS AND SHORT-TERM INVESTMENTS Marketable securities Trade accounts receivable, less allowances of S352 and $331, respectively Inventories Prepaid expenses and other assets Assets held for sale TOTAL CURRENT ASSETS EQUITY METHOD INVESTMENTS OTHER INVESTMENTS OTHER ASSETS PROPERTY, PLANT AND EQUIPMENT net TRADEMARKS WITH INDEFINITE LIVES BOTTLERS' FRANCHISE RIGHTS WITH INDEFINITE LIVES GOODWILL OTHER INTANGIBLE ASSETS 32,986 9,947 3,678 4,407 14,633 6,533 6,689 12,100 1,050 $92,023 318 4,207 5,989 6,000 11,289 TOTAL ASSETS S 90,093 LIABILITIES AND EQUITY CURRENT LIABILITIES $ 9.660 13,129 2,677 yable and accrued expenses S 9,234 19,130 Loans and notes payable Current maturities of long-term debt Accrued income taxes Liabilities held for sale 400 1,133 26.930 28.407 301 TOTAL CURRENT LIABILITIES LONG-TERM DEBT OTHER LIABILITIES DEFERRED INCOME TAXES THE COCA-COLA COMPANY SHAREOWNERS' EQUITY 19,063 4.691 Common stock, $0.25 par value: Authorized-11,200 shares; Issued-7,040 and 7,040 shares, respectively Capital surplus Reinvested earnings Accumulated other comprehensive income (loss) Treasury stock, at cost 2,716 and 2,674 shares, respectively 14,016 65,018 (10,174) (45,066) 63,408 42,225) 30,320 EQUITY ATTRIBUTABLE TO SHAREOWNERS OF THE COCA-COLA COMPANY EQUITY ATTRIBUTABLE TO NONCONTROLLING INTERESTS TOTAL EQUITY 30,561 $ 92,023 90,093 TOTAL LIABILITIES AND EQUITY THE COCA-COLA COMPANY AND SUBSIDIARIES CONSOLIDATED STATEMENTS OF CASH FLOWS Year Ended December 31, 2015 2014 2013 (In millions) OPERATING ACTIVITIES Consolidated net income Depreciation and amortization Stock-based compensation expense Deferred income taxes Equity (income) lossnet of dividends $ 7,366 S 7,124 S 8,626 1977 227 648 1,976 209 40 1,970 236 (122) (374) oreign currency adjustments Significant (gains) losses on sales of assets net Other operating charges Other items Net change in operating assets and liabilities 831 761 (670) 465 234 932 10,542 929 (157) Net cash provided by operating activities INVESTING ACTIVITIES Purchases of investments Proceeds from disposals of investments Acquisitions of businesses, equity method investments and nonmarketable securities Proceeds from disposals of businesses, equity method investments and nonmarketable securities Purchases of property, plant and equipment Proceeds from disposals of property, plant and equipment Other investing activities 10,528 10,615 (15,831 (17,800) (14,782) 12,791 14,079 (2,491) 12,986 148 223 872 (2,553)(2,406 (2,550) 85 (40) 303 Net cash provided by (used in) investing activities FINANCING ACTIVITIES Issuances of debt Payments of debt Issuances of stock Purchases of stock for treasury Dividends Other financing activities (6,186 (7,506) (4,214) 41,674 43,425 37,738)(36,962) (38,714) 40,434 1,245 (5,741) 1,532 (3,564)4,2 (4,832) (5,350) (4,969) 17 363 Net cash provided by (used in) financing activities EFFECT OF EXCHANGE RATE CHANGES ON CASH AND CASH EQUIVALENTS CASH AND CASH EQUIVALENTS Net increase (decrease) during the year Balance at beginning of year (5,113) (3,631) (3,745 934 (878) 1,972 8,442 S 7,309 S 8,958 S 10,414 (1,456) 10,414 (1,649) 8.958 Balance at end of vear THE COCA-COLA COMPANY AND SUBSIDIARIES CONSOLIDATED STATEMENTS OF SHAREOWNERS' EQUITY Year Ended December 31, (In millions except per share data) EQUITY ATTRIBUTABLE TO SHAREOWNERS OF THE COCA-COLA COMPANY 2015 2014 2013 NUMBER OF COMMON SHARES OUTSTANDING 4,402 (98) 4,469 Balance at beginning of year Purchases of treasury stock (121) Treasury stock issued to employees related to stock compensation plans Balance at end of year 54 4,402 1.760 1,760 1,760 4,366 4,324 COMMON STOCK CAPITAL SURPLUS 13,154 12,276 11,379 569 144 227 43 13,154 12,276 Balance at beginning of year 526 169 209 (26) Stock issued to employees related to stock compensation plans Tax benefit (charge) from stock compensation plans Stock-based compensation Other activities 532 236 Balance at end of year 14,016 REINVESTED EARNINGS 58,045 8,584 5,741) (5,350) (4,969) 61,660 Balance at beginning of year 63.408 61,660 7,098 Net income attributable to shareowners of The Coca-Cola Company Dividends (per share Balance at end of year $1.32, $1.22 and $1.12 in 2015, 2014 and 2013, respectively) 63,408 65,018 ACCUMULATED OTHER COMPREHENSIVE INCOME (LOSS) (5,777) 3,432) 3,385) (47 10,174 (5,777) (3,432) Balance at beginning of year Net other comprehensive income (loss Balance at end of year (4,397)(2,345) TREASURY STOCK (42,225) (39,091) (35,009) 745 (3,537)4,025) (4,827) 39,091 25,554 S 30,320 S 33,173 Balance at beginning of year 891 Stock issued to employees related to stock compensation plans 696 Purchases of treasury stock Balance at end of year (45,066 (42,225 TOTAL EQUITY ATTRIBUTABLE TO SHAREOWNERS OF THE COCA-COLA COMPANY EQUITY ATTRIBUTABLE TO NONCONTROLLING INTERESTS $ 241 267 378 42 Balance at beginning of year 26 Net income attributable to noncontrolling interests Net foreign currency translation adjustment Dividends paid to noncontrolling interests Acquisition of interests held by noncontrolling owners Contributions by noncontrolling interests Business combinations Deconsolidation of certain entities Other activities (18) (31) 34 25 $210 241 267 TOTAL EQUITY ATTRIBUTABLE TO NONCONTROLLING INTERESTS Consolidated Statement of Comprehensive Income PepsiCo. Inc. and Subsidiaries Fiscal years ended December 26, 2015, December 27, 2014 and December 28, 2013 (in millions) Pre-tax amounts After-tax amounts 5,501 ax ainounts ncom Other Comprehensive Loss Currency translation adjustment Reclassification associated with Venezuelan entities (2,938) $ (2,938) Cash flow hedges: Reclassification of net losses to net income Net derivative losses 50 (47) 48 Pension and retiree medical: Reclassification of net losses to net income Reclassification associated with Venezuelan entities Remeasurement of net liabilities and translation 246 (74) 16 17) Unrealized gains on secrities Total Other Comprehensive Loss 2,849 ncome Compre Comprehensive Income Attributable to PepsiCo hensive income attributable to noncontrolling interests 2014 Tax amounts Pre-tax amounts After-tax amounts 6,558 (5,010) Net income Other Comprehensive Loss (5,010) $ y translation adjustment Cash flow hedges: 249 (88) Reclassification of net losses to net income Net derivative losses (95) Pension and retiree medical: 369 (1,323) (122) 437 247 Reclassification of net losses to net income Remeasurement of net liabilities and translation Unrealized losses on securities Total Other Comprehensive Loss 5,813 269 5,544 ncome Comprehensive income attributable to noncontrolling interests Comprehensive Income Attributable to PepsiCo 2013 Tax amounts Pre-tax amounts After-tax amounts Net income Other Comprehensive Income 6,787 Currency translation adjustment Cash flow hedges: (1,303) $ (1,303) 28 (10) Reclassification of net losses to net income Net derivative losses (20) Pension and retiree medical: 353 2,164 (123) Reclassification of net losses to net income Remeasurement of net liabilities and translation 230 1,400 29 (764) (28) Unrealized gains on securities Other Total Other Comprehensive Income 938 1,145 Comprehensive income attributable to noncontrolling interests Comprehensive Income Attributable to PepsiCo See accompanying notes to the consolidated financial statements. Operating Activities 2,625 2,416 Merger and integration charges 230 163 Charge related to the transaction with Tingyi 1,359 Excess tax benefits from share-based payment arrangements (133) (117) Pension and retiree medical plan contributions (655) 3l5 Change in assets and liabilities: HaD (244) 1,692 1,162 1,007 (285) Other, net 269) (349 Capital spending (2,795 T1S (88) (86) (109 Divestitures 130 More than three months - purchases (4,428) (6,305) Three months or less, net Net Cash Used for Investing Activities Financing Activities Pavments oflong-term debt More than three months proceeds 15 50 23 Three months or less, net Proceeds from exercises of stock options Acquisition of noncontrolling interests Net Cash Used for Financing Activities Net Increase/(Decrease) in Cash and Cash Equivalents Cash and Cash Equivalents, End of Yea 504 962 (3,241) $ 9,096 $6,134 9,37 Consolidated Balance Sheet PepsiCo. Inc. and Subsidiaries December 26, 2015 and December 27, 2014 (in millions except per share amounts) 2015 2014 ASSETS Current Assets Cash and cash equivalents Short-term investments Accounts and notes receivable, net $ 9,096 S6,134 2,592 6,651 3,143 2,143 20,663 17,244 1,449 14,965 12,639 27,604 2,689 860 69,667 70,509 2,913 6,437 2,720 1,865 23,031 16,317 1,270 14,177 11,811 25,988 2,311 750 Prepaid expenses and other current assets Total Current Assets Property, Plant and Equipment, net Amortizable Intangible Assets, net Goodwil1 Other nonamortizable intangible assets Nonamortizable Intangible Assets Investments in Noncontrolled Affiliates Other Assets Total Assets LIABILITIES AND EQUITY Current Liabilities Short-term obligations Accounts payable and other current liabilities S 4,071 5,076 13,016 18,092 23,821 5,744 5,304 52,961 13,507 17,578 29,213 5,887 4,959 57,637 Total Current Liabilities Long-Tem Debt Obligations Other Liabilities Deferred Income Tares Total Liabilities Commitments and contingencies Preferred Stock, no par value Repurchased Preferred Stock PepsiCo Common Shareholders' Equity Common stock par value 1/ae per share (authorized 3,600 shares, issued, net of repurchased (186) 25 common stock at par value: 1,448 and 1,488 shares, respectively) Capital in excess of par value Retained earnings Accumulated other comprehensive loss Repurchased common stock, in excess of par value (418 and 378 shares, respectively) 24 4,076 50,472 49,092 (13,319) (10,669) (29,185) (24,985) 17,578 Total PepsiCo Common Shareholders' Equity 12,068 107 12,030 Noncontrolling interests 17,548 69,667 $ 70,509 Total Equity Total Liabilities and Equity See accompanying notes to the consolidated financial statements. Consolidated Statement of Equity PepsiCo. Inc. and Subsidiaries Fiscal years ended December 26, 2015, December 27, 2014 and December 28, 2013 (in millions) 2014 Shares Preferred Stock Repurchased Preferred Stock 0.8 S (0.7) Balance, beginning of year Balance, end of year Balance, beginning of year Balance, end of year Balance, beginning of year Stock option exercises, RSUs, PSUs and PEPunits (181) (171) 0.6) (164) Common Stock 1,488 1,529 1,544 common stock Capital in Excess of Par Value 4,115 299 4.095 converted Withholding tax on RSUs, PSUs and PEPunits (91) 4.115 46,420 (3,840) (151) Balance, end of year 4.095 Retained Earnings Balance, beginning of year Net income attibutable to PepsiCo Cash dividends declared-common Cash dividends declared preferred Balance, end of year 49,092 5,452 (4,071) 43,158 6,740 (3,477) 50,472 Accumulated Other Comprehensive Loss (10,669) (2,650) Balance, beginning of year Other comprehensive (loss)income attributable to (5,487) (5,542) Balance, end of year Repurchased Coininon Stock Balance, beginning of year Share repurchases (378) (24,985) (4,999) (337) (57) (21,004) (5,012) 1,030 (322) (37) (19,458) 3,000) option exercises, RSUs, PSUs and PEPunits 21.004 Balance, end of year Total PepsiCo Common Shareholders' Equity Noncontrolling Interests 12,068 110 (48) 24.409 105 (34) 110 Balance, beginning of year Net income attributable to (41) Other, net Balance, end of year Total Equity $ 17,548 $ 24,389 S 12.030 (a) Includes total tax benefits of $107 million in 2015, $74 million in 2014 and $45 million in 2013 See accompanying notes to the consolidated financial statements. THE COCA-COLA COMPANY AND SUBSIDIARIES CONSOLIDATED STATEMENTS OF INCOME Year Ended December 31, (In millions except per share data) NET OPERATING REVENUES Cost of goods sold GROSS PROFIT Selling, general and administrative expenses Other operating charges OPERATING INCOME Interest income Interest expense Equity income (loss)-net Other income (loss)net 2015 2014 2013 44,294 45,998 46,854 18,421 28,10928,433 17,218 17,310 895 9,70810,228 534 463 602 576 9,325 11,477 2,851 8,626 42 17,482 26,812 16,427 1,657 8,728 613 856 489 631 9,605 2,239 7,366 15 17,889 1,183 594 483 769 1,263 INCOME BEFORE INCOME TAXES Income taxes CONSOLIDATED NET INCOME Less: Net income attributable to noncontrolling interests NET INCOME ATTRIBUTABLE TO SHAREOWNERS OF THE COCA-COLA COMPANY 2,201 7,124 26 7,357,098 S 8,584 1.69 1.62 1.94 1.671.60 1.90 4,387 BASIC NET INCOME PER SHARE DILUTED NET INCOME PER SHARE 4,434 75 4,509 AVERAGE SHARES OUTSTANDING Effect of dilutive securities AVERAGE SHARES OUTSTANDING ASSUMING DILUTION 4,352 53 63 4,450 4,405 Calculated based on net income attributable to shareowners of The Coca-Cola Company THE COCA-COLA COMPANY AND SUBSIDIARIES CONSOLIDATED STATEMENTS OF COMPREHENSIVE INCOME 2015 Year Ended December 31, (In millions) CONSOLIDATED NET INCOME Other comprehensive income 2014 2013 $ 7,366 S 7,124 8,626 Net foreign currency translation adjustment Net gain (loss) on derivatives Net unrealized gain (loss) on available-for-sale securities Net change in pension and other benefit liabilities 3,959) (2,382) (1,187) 357 714 86 (1,039) ,066 2,951 4,774 8,576 21 142 (684) 151 TOTAL COMPREHENSIVE INCOME Less: Comprehensive income (loss) attributable to noncontrolling interests TOTAL COMPREHENSIVE INCOME ATTRIBUTABLE TO SHAREOWNERS OF 39 2,954 4,753 8,5317 THE COCA-COLA COMPANY THE COCA-COLA COMPANY AND SUBSIDIARIES CONSOLIDATED BALANCE SHEETS December 31 2015 2014 (In millions except par value) ASSETS CURRENT ASSETS $ 7,309 8.322 Cash and cash equivalents Short-term investments S 8,958 9,052 18,010 3,665 4,466 5,631 4,269 3.941 2,902 2.752 3,900 33,395 TOTAL CASH, CASH EQUIVALENTS AND SHORT-TERM INVESTMENTS Marketable securities Trade accounts receivable, less allowances of S352 and $331, respectively Inventories Prepaid expenses and other assets Assets held for sale TOTAL CURRENT ASSETS EQUITY METHOD INVESTMENTS OTHER INVESTMENTS OTHER ASSETS PROPERTY, PLANT AND EQUIPMENT net TRADEMARKS WITH INDEFINITE LIVES BOTTLERS' FRANCHISE RIGHTS WITH INDEFINITE LIVES GOODWILL OTHER INTANGIBLE ASSETS 32,986 9,947 3,678 4,407 14,633 6,533 6,689 12,100 1,050 $92,023 318 4,207 5,989 6,000 11,289 TOTAL ASSETS S 90,093 LIABILITIES AND EQUITY CURRENT LIABILITIES $ 9.660 13,129 2,677 yable and accrued expenses S 9,234 19,130 Loans and notes payable Current maturities of long-term debt Accrued income taxes Liabilities held for sale 400 1,133 26.930 28.407 301 TOTAL CURRENT LIABILITIES LONG-TERM DEBT OTHER LIABILITIES DEFERRED INCOME TAXES THE COCA-COLA COMPANY SHAREOWNERS' EQUITY 19,063 4.691 Common stock, $0.25 par value: Authorized-11,200 shares; Issued-7,040 and 7,040 shares, respectively Capital surplus Reinvested earnings Accumulated other comprehensive income (loss) Treasury stock, at cost 2,716 and 2,674 shares, respectively 14,016 65,018 (10,174) (45,066) 63,408 42,225) 30,320 EQUITY ATTRIBUTABLE TO SHAREOWNERS OF THE COCA-COLA COMPANY EQUITY ATTRIBUTABLE TO NONCONTROLLING INTERESTS TOTAL EQUITY 30,561 $ 92,023 90,093 TOTAL LIABILITIES AND EQUITY THE COCA-COLA COMPANY AND SUBSIDIARIES CONSOLIDATED STATEMENTS OF CASH FLOWS Year Ended December 31, 2015 2014 2013 (In millions) OPERATING ACTIVITIES Consolidated net income Depreciation and amortization Stock-based compensation expense Deferred income taxes Equity (income) lossnet of dividends $ 7,366 S 7,124 S 8,626 1977 227 648 1,976 209 40 1,970 236 (122) (374) oreign currency adjustments Significant (gains) losses on sales of assets net Other operating charges Other items Net change in operating assets and liabilities 831 761 (670) 465 234 932 10,542 929 (157) Net cash provided by operating activities INVESTING ACTIVITIES Purchases of investments Proceeds from disposals of investments Acquisitions of businesses, equity method investments and nonmarketable securities Proceeds from disposals of businesses, equity method investments and nonmarketable securities Purchases of property, plant and equipment Proceeds from disposals of property, plant and equipment Other investing activities 10,528 10,615 (15,831 (17,800) (14,782) 12,791 14,079 (2,491) 12,986 148 223 872 (2,553)(2,406 (2,550) 85 (40) 303 Net cash provided by (used in) investing activities FINANCING ACTIVITIES Issuances of debt Payments of debt Issuances of stock Purchases of stock for treasury Dividends Other financing activities (6,186 (7,506) (4,214) 41,674 43,425 37,738)(36,962) (38,714) 40,434 1,245 (5,741) 1,532 (3,564)4,2 (4,832) (5,350) (4,969) 17 363 Net cash provided by (used in) financing activities EFFECT OF EXCHANGE RATE CHANGES ON CASH AND CASH EQUIVALENTS CASH AND CASH EQUIVALENTS Net increase (decrease) during the year Balance at beginning of year (5,113) (3,631) (3,745 934 (878) 1,972 8,442 S 7,309 S 8,958 S 10,414 (1,456) 10,414 (1,649) 8.958 Balance at end of vear THE COCA-COLA COMPANY AND SUBSIDIARIES CONSOLIDATED STATEMENTS OF SHAREOWNERS' EQUITY Year Ended December 31, (In millions except per share data) EQUITY ATTRIBUTABLE TO SHAREOWNERS OF THE COCA-COLA COMPANY 2015 2014 2013 NUMBER OF COMMON SHARES OUTSTANDING 4,402 (98) 4,469 Balance at beginning of year Purchases of treasury stock (121) Treasury stock issued to employees related to stock compensation plans Balance at end of year 54 4,402 1.760 1,760 1,760 4,366 4,324 COMMON STOCK CAPITAL SURPLUS 13,154 12,276 11,379 569 144 227 43 13,154 12,276 Balance at beginning of year 526 169 209 (26) Stock issued to employees related to stock compensation plans Tax benefit (charge) from stock compensation plans Stock-based compensation Other activities 532 236 Balance at end of year 14,016 REINVESTED EARNINGS 58,045 8,584 5,741) (5,350) (4,969) 61,660 Balance at beginning of year 63.408 61,660 7,098 Net income attributable to shareowners of The Coca-Cola Company Dividends (per share Balance at end of year $1.32, $1.22 and $1.12 in 2015, 2014 and 2013, respectively) 63,408 65,018 ACCUMULATED OTHER COMPREHENSIVE INCOME (LOSS) (5,777) 3,432) 3,385) (47 10,174 (5,777) (3,432) Balance at beginning of year Net other comprehensive income (loss Balance at end of year (4,397)(2,345) TREASURY STOCK (42,225) (39,091) (35,009) 745 (3,537)4,025) (4,827) 39,091 25,554 S 30,320 S 33,173 Balance at beginning of year 891 Stock issued to employees related to stock compensation plans 696 Purchases of treasury stock Balance at end of year (45,066 (42,225 TOTAL EQUITY ATTRIBUTABLE TO SHAREOWNERS OF THE COCA-COLA COMPANY EQUITY ATTRIBUTABLE TO NONCONTROLLING INTERESTS $ 241 267 378 42 Balance at beginning of year 26 Net income attributable to noncontrolling interests Net foreign currency translation adjustment Dividends paid to noncontrolling interests Acquisition of interests held by noncontrolling owners Contributions by noncontrolling interests Business combinations Deconsolidation of certain entities Other activities (18) (31) 34 25 $210 241 267 TOTAL EQUITY ATTRIBUTABLE TO NONCONTROLLING INTERESTS