Answered step by step
Verified Expert Solution
Question
1 Approved Answer
Comparative financial statement data for Flint Corporation and Culver Corporation, two competitors, appear below. All balance sheet data are as of December 31, 2 Net
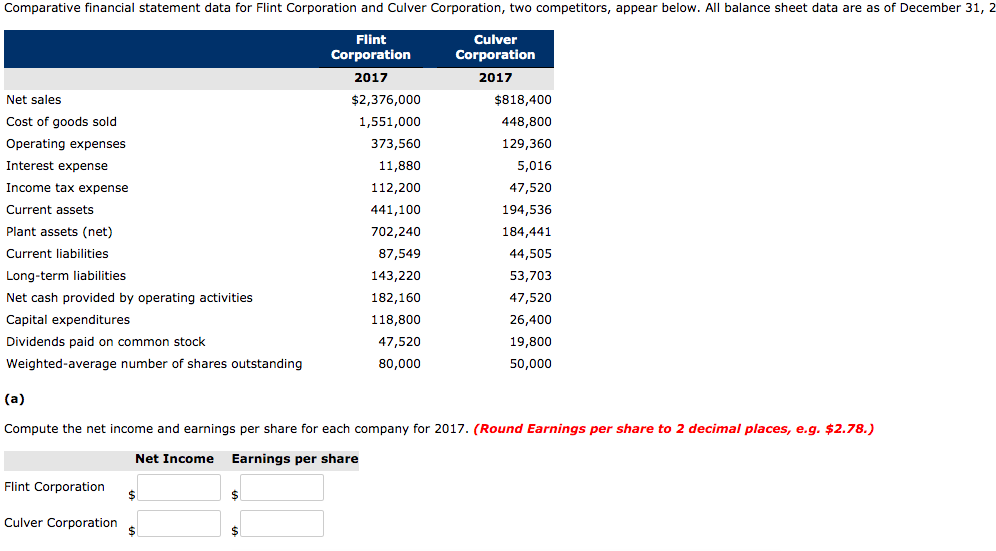
Comparative financial statement data for Flint Corporation and Culver Corporation, two competitors, appear below. All balance sheet data are as of December 31, 2 Net sales Cost of goods sold Operating expenses Interest expense Income tax expense Current assets Plant assets (net) Current liabilities Long-term liabilities Net cash provided by operating activities Capital expenditures Dividends paid on common stock Weighted average number of shares outstanding Flint Corporation 2017 $2,376,000 1,551,000 373,560 11,880 112,200 441,100 702,240 87,549 143,220 182,160 118,800 47,520 80,000 Culver Corporation 2017 $818,400 448,800 129,360 5,016 47,520 194,536 184,441 44,505 53,703 47,520 26,400 19,800 50,000 (a) Compute the net income and earnings per share for each company for 2017. (Round Earnings Net Income Earnings per share Flint Corporations Culver Corporations Compute working capital and the current ratios for each company for 2017. (Round current ratio to 1 decimal place, e.g. 0.7 : 1.) Working Capital Current Ratios Flint Corporation Culver Corporations (c) Compute the debt to assets ratio and the free cash flow for each company for 2017. (Round debt to assets to 1 decimal place, e.g. 78.9%. Enter negative amounts using either a negative sign preceding the number e.g. -45 or parentheses e.g. (45).) Debt to Assets Free Cash Flow Flint Corporation % $ Culver Corporation % $
Step by Step Solution
There are 3 Steps involved in it
Step: 1
Get Instant Access to Expert-Tailored Solutions
See step-by-step solutions with expert insights and AI powered tools for academic success
Step: 2
Step: 3
Ace Your Homework with AI
Get the answers you need in no time with our AI-driven, step-by-step assistance
Get Started