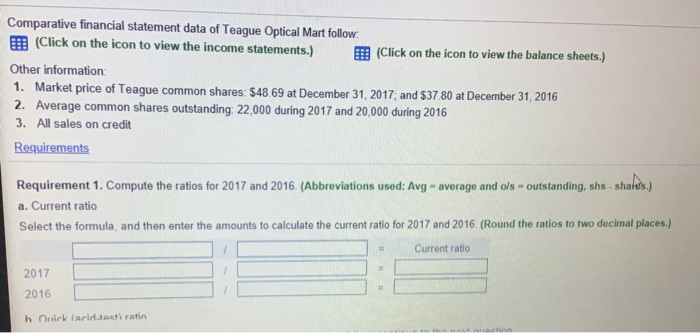
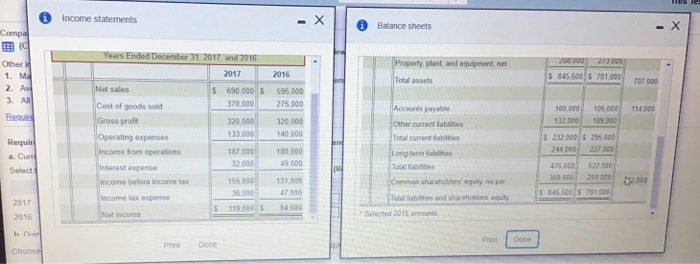
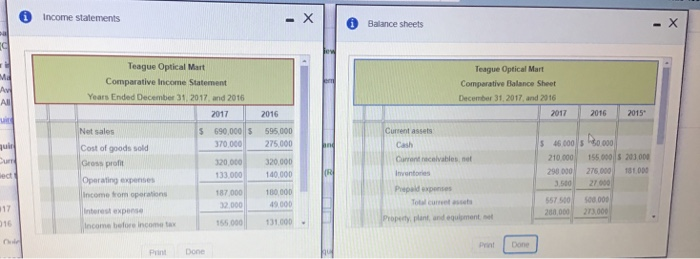
Comparative financial statement data of Teague Optical Mart follow. E (Click on the icon to view the income statements.) (Click on the icon to view the balance sheets.) Other information: 1. Market price of Teague common shares: $48.69 at December 31, 2017; and $37.80 at December 31, 2016 2. Average common shares outstanding: 22,000 during 2017 and 20,000 during 2016 3. All sales on credit Requirements Requirement 1. Compute the ratios for 2017 and 2016. (Abbreviations used: Avg - average and ors-outstanding, shs - - shados.) a. Current ratio Select the formula, and then enter the amounts to calculate the current ratio for 2017 and 2016. (Round the ratios to two decimal places.) Current ratio 2017 2016 huirk (arid test ratin Income statements - X Balance sheets - X Compa C . ZUUUU 23.00 2016 Other 1. ME 2. W 3. All Property, plant, and equipment, net Total assets 5 845.00 S 781.000 707000 114000 Resuir 595,000 275.000 320.000 140.000 100.000 132 000 Years Ended December 31, 2017 and 2016 2017 Net sales $ 690 000 S Cost of goods sold 370.000 Gross profit 320.000 Operating expenses 133.000 Income from operations 187.000 Interest expense Income before income tax 155.000 35.000 Income tax expense 119.000 Net income 106.000 189.000 Requin a. Cum Select 100.000 49 000 Accounts payable Other current liabilities Total current tables Long termes Totalbes Common shareholders uity no per Total abilities and shareholders guilty Selected 2015 amounts S 232 000 5 295.000 244000 227.000 476.000 572 000 369 500 259 000 $ 345 500 S 781000 131.000 47.000 34000 2017 2016 h n Print Done Print Done Choose Income statements Balance sheets " Md Av All Teague Optical Mart Comparative Income Statement Years Ended December 31, 2017 and 2016 2017 2016 595,000 275.000 qui ind $ 690,000 $ 370,000 320.000 133.000 Teague Optical Mart Comparative Balance Sheet December 31, 2017 and 2016 2017 2016 2015 Current assets Cash $ 46.000 30.000 Current receivables, not 210.000 155.000 200.000 Inventories 290.000 275 000 18100 Prepaid 27 000 Total curre asset 557500 S00.00 200,000 273.000 Property plant and equipment Net sales Cost of goods sold Gross profil Operating expenses Income from operations Interest expense Income before income tax 320,000 140.000 IRI 187 000 32 000 180,000 49.000 16 155.000 131.000 Done Print Done