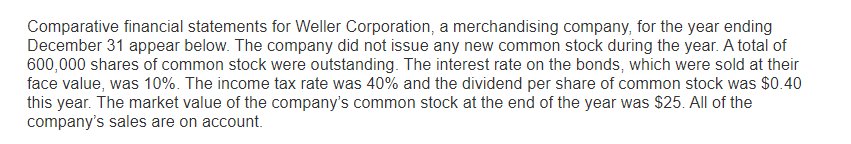
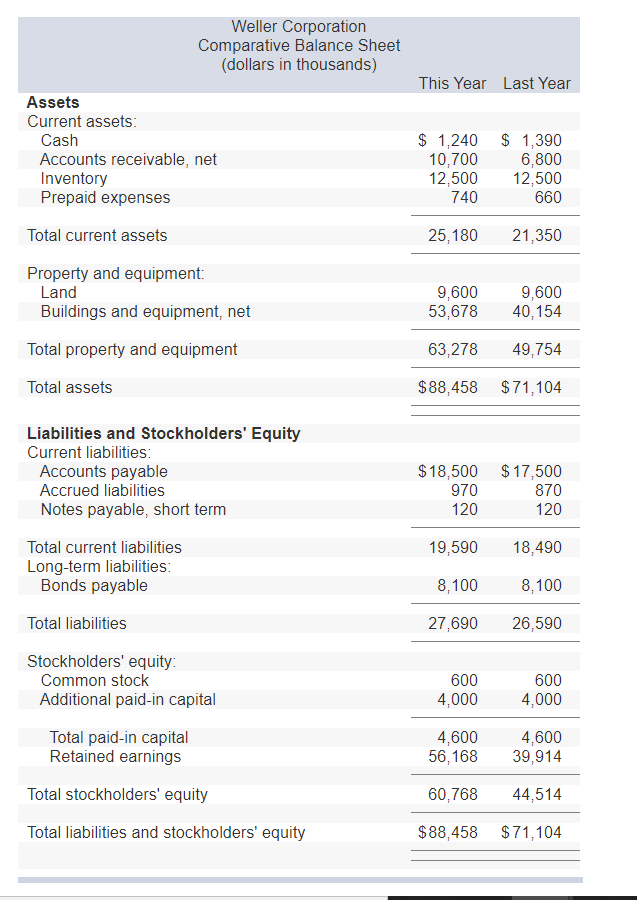
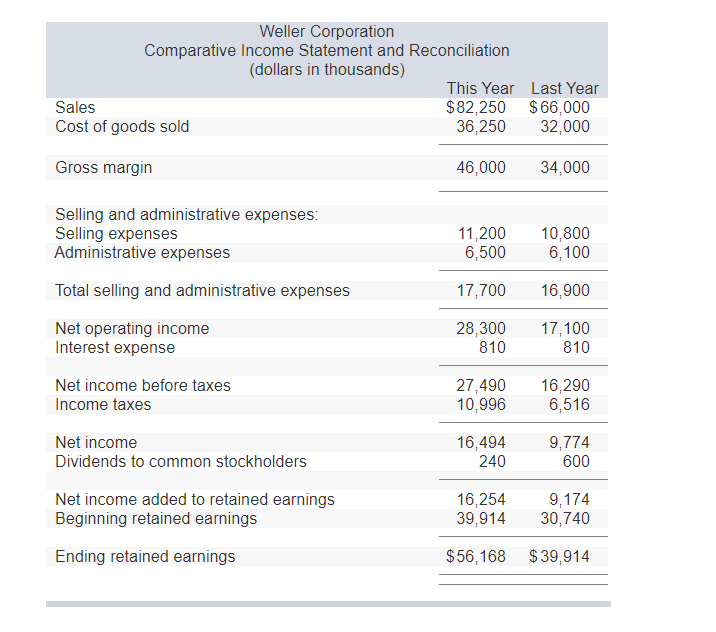
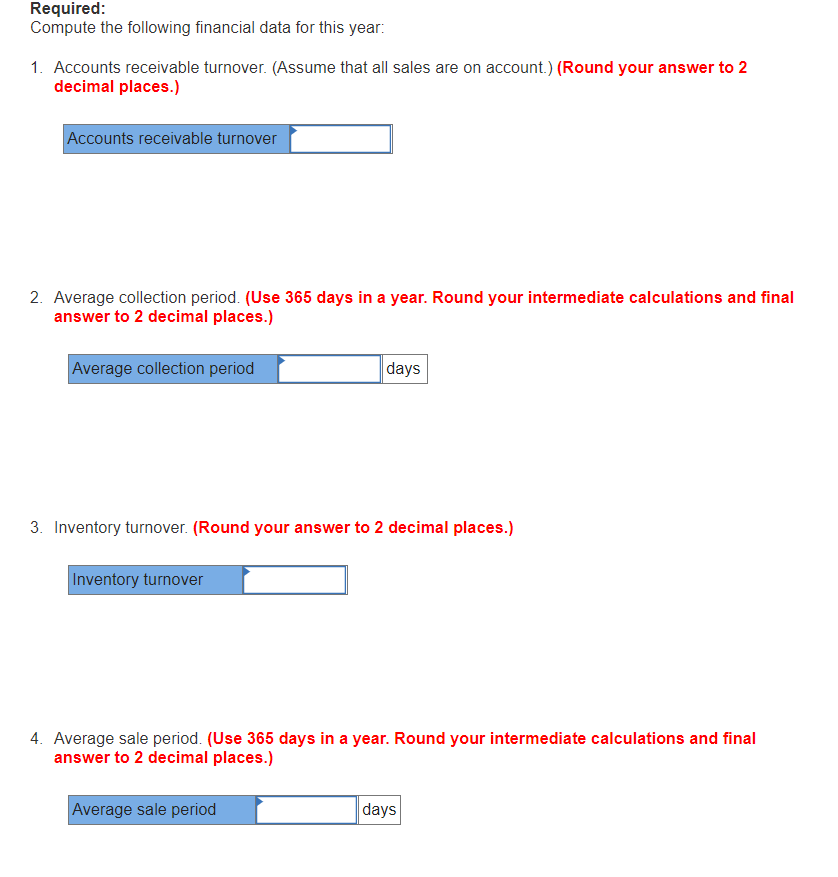
Comparative financial statements for Weller Corporation, a merchandising company, for the year ending December 31 appear below. The company did not issue any new common stock during the year. A total of 600,000 shares of common stock were outstanding. The interest rate on the bonds, which were sold at their face value, was 10%. The income tax rate was 40% and the dividend per share of common stock was $0.40 this year. The market value of the company's common stock at the end of the year was $25. All of the company's sales are on account. Weller Corporation Comparative Balance Sheet (dollars in thousands) This Year Last Year Assets Current assets: Cash Accounts receivable, net Inventory Prepaid expenses $ 1,240 $ 1,390 10,700 6,800 12,500 12,500 740 660 Total current assets 25,180 21,350 Property and equipment: Land Buildings and equipment, net 9,600 53,678 9,600 40,154 Total property and equipment 63,278 49,754 Total assets $88,458 $71,104 Liabilities and Stockholders' Equity Current liabilities: Accounts payable Accrued liabilities Notes payable, short term $18,500 $17,500 970 870 120 120 19,590 18,490 Total current liabilities Long-term liabilities: Bonds payable 8,100 8,100 Total liabilities 27,690 26,590 Stockholders' equity Common stock Additional paid-in capital 600 4,000 600 4,000 Total paid-in capital Retained earnings Total stockholders' equity 4,600 56,168 4,600 39,914 60,768 44,514 Total liabilities and stockholders' equity $88,458 $71,104 Weller Corporation Comparative Income Statement and Reconciliation (dollars in thousands) This Year Last Year Sales $82,250 $66,000 Cost of goods sold 36,250 32,000 Gross margin 46,000 34,000 Selling and administrative expenses: Selling expenses Administrative expenses Total selling and administrative expenses 11,200 6,500 10,800 6,100 17,700 16,900 Net operating income Interest expense 28,300 810 17,100 810 Net income before taxes Income taxes 27,490 10,996 16,290 6,516 Net income Dividends to common stockholders 16,494 240 9,774 600 16,254 39,914 9,174 30,740 Net income added to retained earnings Beginning retained earnings Ending retained earnings $56,168 $39,914 Required: Compute the following financial data for this year: 1. Accounts receivable turnover. (Assume that all sales are on account.) (Round your answer to 2 decimal places.) Accounts receivable turnover 2. Average collection period. (Use 365 days in a year. Round your intermediate calculations and final answer to 2 decimal places.) Average collection period days 3. Inventory turnover. (Round your answer to 2 decimal places.) Inventory turnover 4. Average sale period. (Use 365 days in a year. Round your intermediate calculations and final answer to 2 decimal places.) Average sale period days 5. Operating cycle. (Round your intermediate calculations and final answer to 2 decimal places.) Operating cycle days 6. Total asset turnover. (Round your answer to 2 decimal places.) Total asset turnover