

Comparative income statement data for Crane Inc. and Pronghorn Ltd., two competitors, are shown below for the year ended December 31, 2021. Crane Pronghorn
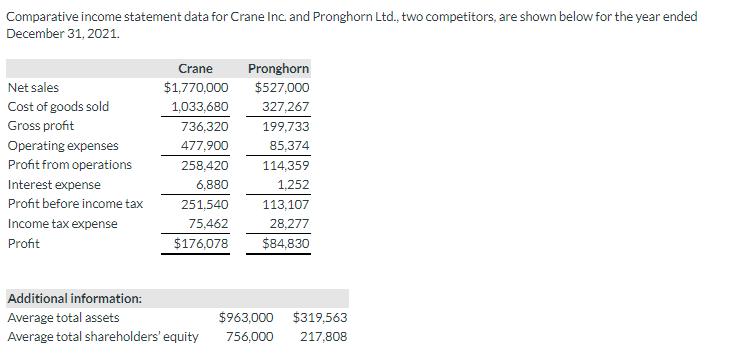
Comparative income statement data for Crane Inc. and Pronghorn Ltd., two competitors, are shown below for the year ended December 31, 2021. Crane Pronghorn Net sales $1,770,000 $527,000 Cost of goods sold 1,033,680 327,267 Gross profit 736,320 199,733 Operating expenses 477,900 85,374 Profit from operations 258,420 114,359 Interest expense 6,880 1,252 Profit before income tax 251,540 113,107 Income tax expense 75,462 Profit $176,078 28,277 $84,830 Additional information: Average total assets $963,000 $319,563 Average total shareholders' equity 756,000 217,808
Step by Step Solution
There are 3 Steps involved in it
Step: 1

See step-by-step solutions with expert insights and AI powered tools for academic success
Step: 2

Step: 3
Ace Your Homework with AI
Get the answers you need in no time with our AI-driven, step-by-step assistance
Get Started
Authors: Jerry J. Weygandt, Donald E. Kieso, Paul D. Kimmel, Barbara Trenholm, Valerie Kinnear, Joan E. Barlow
6th Canadian edition Volume 1
1118306805, 978-1118306802