Answered step by step
Verified Expert Solution
Question
1 Approved Answer
Compare risk factors in men and women using excel formulas on a... 1. Compare risk factors in men and women using excel formulas on

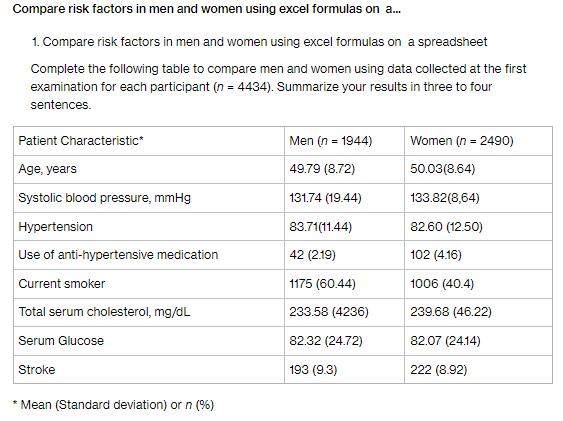
Compare risk factors in men and women using excel formulas on a... 1. Compare risk factors in men and women using excel formulas on a spreadsheet Complete the following table to compare men and women using data collected at the first examination for each participant (n = 4434). Summarize your results in three to four sentences. Patient Characteristic* Age, years Systolic blood pressure, mmHg Hypertension Use of anti-hypertensive medication Current smoker Total serum cholesterol, mg/dL Serum Glucose Stroke * Mean (Standard deviation) or n (%) Men (n = 1944) 49.79 (8.72) 131.74 (19.44) 83.71(11.44) 42 (219) 1175 (60.44) 233.58 (4236) 82.32 (24.72) 193 (9.3) Women (n = 2490) 50.03(8.64) 133.82(8,64) 82.60 (12.50) 102 (4.16) 1006 (40.4) 239.68 (46.22) 82.07 (24.14) 222 (8.92)
Step by Step Solution
★★★★★
3.42 Rating (158 Votes )
There are 3 Steps involved in it
Step: 1
SOLUTION To compare risk factors in men and women using Excel formulas you can perform various calculations and statistical analysis Heres how you can summarize the results based on the provided data ...
Get Instant Access to Expert-Tailored Solutions
See step-by-step solutions with expert insights and AI powered tools for academic success
Step: 2

Step: 3

Ace Your Homework with AI
Get the answers you need in no time with our AI-driven, step-by-step assistance
Get Started


