Question
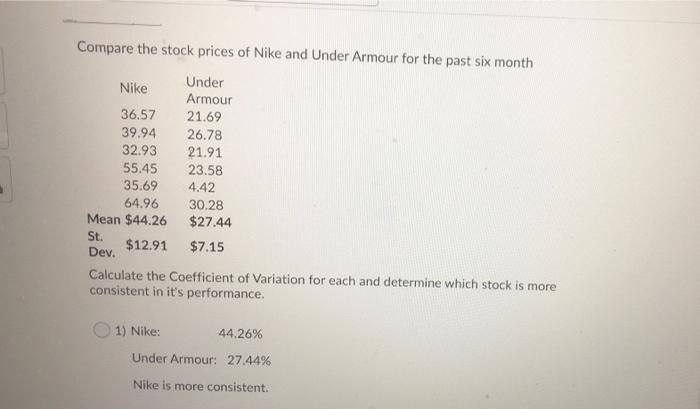
Compare the stock prices of Nike and Under Armour for the past six month Under Nike Armour 36.57 21.69 39.94 26.78 32.93 21.91 St.


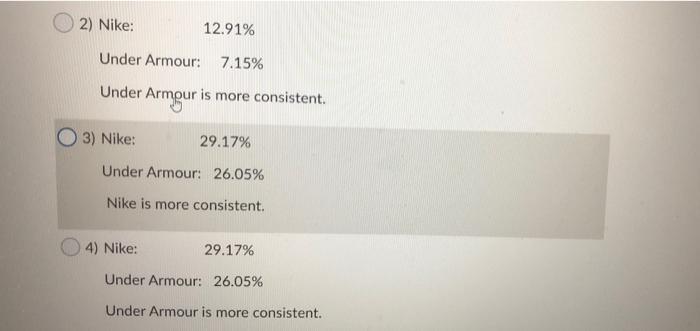
Compare the stock prices of Nike and Under Armour for the past six month Under Nike Armour 36.57 21.69 39.94 26.78 32.93 21.91 St. Dev. 55.45 23.58 35.69 4.42 64.96 Mean $44.26 30.28 $27.44 $12.91 $7.15 Calculate the Coefficient of Variation for each and determine which stock is more consistent in it's performance. 1) Nike: 44.26% Under Armour: 27.44% Nike is more consistent. 2) Nike: 12.91% Under Armour: 7.15% Under Armour is more consistent. (3) Nike: 29.17% Under Armour: 26.05% Nike is more consistent. 29.17% Under Armour: 26.05% Under Armour is more consistent. 4) Nike:
Step by Step Solution
There are 3 Steps involved in it
Step: 1
Answer To calculate the coefficient of variation CV we u...
Get Instant Access to Expert-Tailored Solutions
See step-by-step solutions with expert insights and AI powered tools for academic success
Step: 2

Step: 3

Ace Your Homework with AI
Get the answers you need in no time with our AI-driven, step-by-step assistance
Get StartedRecommended Textbook for
An Introduction To Statistical Methods And Data Analysis
Authors: R. Lyman Ott, Micheal T. Longnecker
7th Edition
1305269470, 978-1305465527, 1305465520, 978-1305269477
Students also viewed these Accounting questions
Question
Answered: 1 week ago
Question
Answered: 1 week ago
Question
Answered: 1 week ago
Question
Answered: 1 week ago
Question
Answered: 1 week ago
Question
Answered: 1 week ago
Question
Answered: 1 week ago
Question
Answered: 1 week ago
Question
Answered: 1 week ago
Question
Answered: 1 week ago
Question
Answered: 1 week ago
Question
Answered: 1 week ago
Question
Answered: 1 week ago
Question
Answered: 1 week ago
Question
Answered: 1 week ago
Question
Answered: 1 week ago
Question
Answered: 1 week ago
Question
Answered: 1 week ago
Question
Answered: 1 week ago
Question
Answered: 1 week ago
Question
Answered: 1 week ago
Question
Answered: 1 week ago
Question
Answered: 1 week ago
Question
Answered: 1 week ago
View Answer in SolutionInn App


