

Answered step by step
Verified Expert Solution
Question
1 Approved Answer
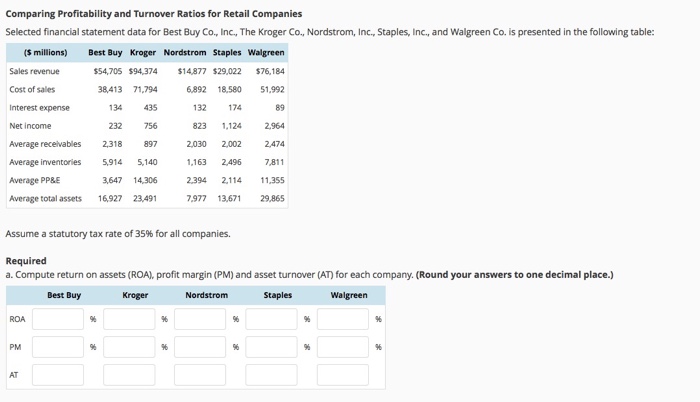
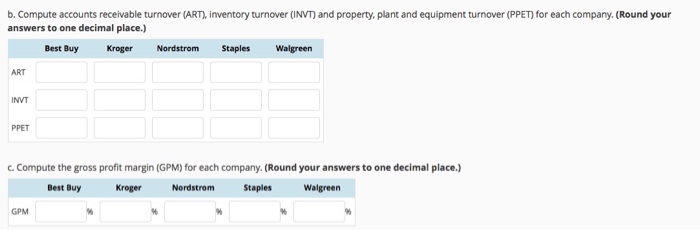
Comparing Profitability and Turnover Ratios for Retail Companies Selected financial statement data for Best Buy Co, Inc., The Kroger Co., Nordstrom, Inc., Staples, Inc., and
Step by Step Solution
There are 3 Steps involved in it
Step: 1

Get Instant Access to Expert-Tailored Solutions
See step-by-step solutions with expert insights and AI powered tools for academic success
Step: 2

Step: 3
Ace Your Homework with AI
Get the answers you need in no time with our AI-driven, step-by-step assistance
Get Started
The Internet Market Research Audit
Authors: Cambridge
1st Edition
1902433742, 978-1902433745