Answered step by step
Verified Expert Solution
Question
1 Approved Answer
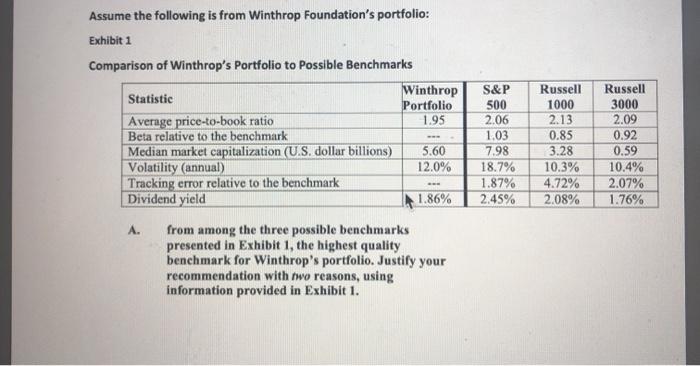
Comparison of Winthrops Portfolio to Possible Benchmarks Statistic Winthrop Portfolio S&P 500 Russell 1000 Russell 3000 Average price-to-book ratio 1.95 2.06 2.13 2.09 Beta relative
Comparison of Winthrops Portfolio to Possible Benchmarks
| Statistic | Winthrop Portfolio | S&P 500 | Russell 1000 | Russell 3000 |
| Average price-to-book ratio | 1.95 | 2.06 | 2.13 | 2.09 |
| Beta relative to the benchmark | --- | 1.03 | 0.85 | 0.92 |
| Median market capitalization (U.S. dollar billions) | 5.60 | 7.98 | 3.28 | 0.59 |
| Volatility (annual) | 12.0% | 18.7% | 10.3% | 10.4% |
| Tracking error relative to the benchmark | --- | 1.87% | 4.72% | 2.07% |
| Dividend yield | 1.86% | 2.45% | 2.08% | 1.76% |
- from among the three possible benchmarks presented in Exhibit 1, the highest quality benchmark for Winthrops portfolio. Justify your recommendation with two reasons, using information provided in Exhibit 1.

Step by Step Solution
There are 3 Steps involved in it
Step: 1

Get Instant Access to Expert-Tailored Solutions
See step-by-step solutions with expert insights and AI powered tools for academic success
Step: 2

Step: 3

Ace Your Homework with AI
Get the answers you need in no time with our AI-driven, step-by-step assistance
Get Started


