Complete a financial analysis on NIKE and ADIDAS using their 2019 annual financial statements. Thoroughly answer the following questions.
1. What are the primary lines of business of these two companies as shown in their notes to the financial statement?
2. Which company has the dominant position in their industry?
3. What are the gross profits, operating profits, and net income for these two companies?
4. Compute both companies' cash coverage ratio, current ratio, and free cash flow.
5. What ratios do each of these companies use in the Management's Discussion and Analysis section of the annual report to explain their financial condition related to debt financing (meaning you MUST find each of the two firms' annual reports)?
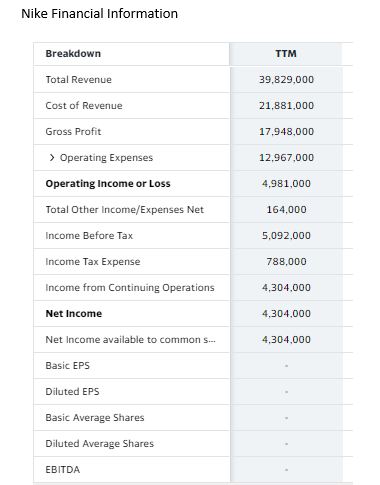
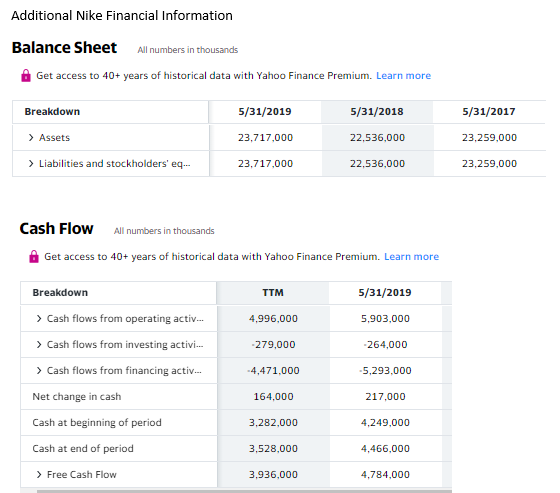
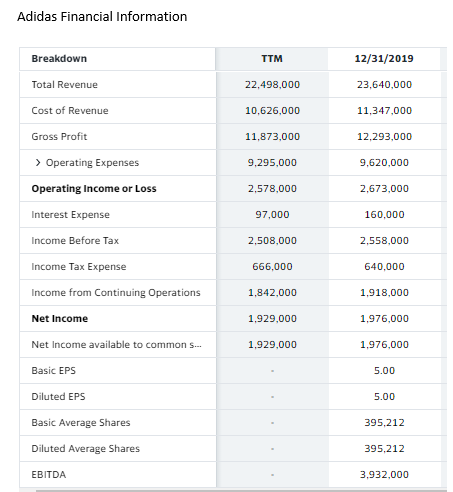
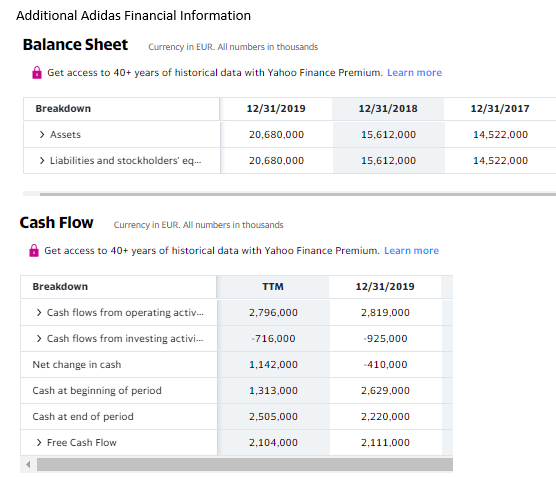
Nike Financial Information Breakdown TTM 39,829,000 21,881.000 17,948,000 Total Revenue Cost of Revenue Gross Profit > Operating Expenses Operating Income or Loss Total Other Income/Expenses Net 12.967,000 4,981,000 164,000 Income Before Tax 5,092,000 788,000 4,304,000 4,304,000 Income Tax Expense Income from Continuing Operations Net Income Net Income available to commons... Basic EPS Diluted EPS Basic Average Shares 4,304,000 Diluted Average Shares EBITDA Additional Nike Financial Information Balance Sheet Get access to 40+ years of historical data with Yahoo Finance Premium. Learn more All numbers in thousands Breakdown 5/31/2019 5/31/2018 5/31/2017 > Assets 23,717.000 22,536,000 23,259,000 > Liabilities and stockholders' eq.-- 23,717,000 22,536,000 23,259,000 Cash Flow All numbers in thousands Get access to 40+ years of historical data with Yahoo Finance Premium. Learn more TTM 5/31/2019 4,996,000 5.903.000 -279.000 -264,000 Breakdown > Cash flows from operating activ... > Cash flows from investing activi... > Cash flows from financing activ... Net change in cash Cash at beginning of period Cash at end of period -4,471.000 -5,293.000 164,000 217,000 3,282,000 4,249,000 3,528,000 4,466,000 > Free Cash Flow 3.936.000 4,784,000 Adidas Financial Information Breakdown TTM 12/31/2019 Total Revenue 22,498,000 23,640,000 10.626,000 11,347,000 11,873,000 12,293,000 9.295,000 9,620,000 2.578,000 2.673,000 Cost of Revenue Gross Profit > Operating Expenses Operating Income or Loss Interest Expense Income Before Tax Income Tax Expense Income from Continuing Operations Net Income 97,000 160,000 2,508,000 2.558,000 666,000 640,000 1,842.000 1,918.000 1,929.000 1,976,000 1,929,000 1,976.000 Net Income available to commons... Basic EPS 5.00 5.00 Diluted EPS Basic Average Shares 395,212 Diluted Average Shares 395,212 EBITDA 3,932,000 Additional Adidas Financial Information Balance Sheet Currency in EUR. All numbers in thousands Get access to 40+ years of historical data with Yahoo Finance Premium. Learn more Breakdown 12/31/2019 12/31/2018 12/31/2017 > Assets 20.680,000 15,612,000 14,522,000 > Liabilities and stockholders' eq... 20,680,000 15,612,000 14,522,000 Cash Flow Currency in EUR. All numbers in thousands Get access to 40+ years of historical data with Yahoo Finance Premium. Learn more TTM 12/31/2019 2,796,000 2,819.000 -716,000 -925,000 Breakdown > Cash flows from operating activ... > Cash flows from investing activi.. Net change in cash Cash at beginning of period Cash at end of period 1,142,000 - 410,000 1.313,000 2,629,000 2,505.000 2,220,000 > Free Cash Flow 2.104,000 2,111,000 Nike Financial Information Breakdown TTM 39,829,000 21,881.000 17,948,000 Total Revenue Cost of Revenue Gross Profit > Operating Expenses Operating Income or Loss Total Other Income/Expenses Net 12.967,000 4,981,000 164,000 Income Before Tax 5,092,000 788,000 4,304,000 4,304,000 Income Tax Expense Income from Continuing Operations Net Income Net Income available to commons... Basic EPS Diluted EPS Basic Average Shares 4,304,000 Diluted Average Shares EBITDA Additional Nike Financial Information Balance Sheet Get access to 40+ years of historical data with Yahoo Finance Premium. Learn more All numbers in thousands Breakdown 5/31/2019 5/31/2018 5/31/2017 > Assets 23,717.000 22,536,000 23,259,000 > Liabilities and stockholders' eq.-- 23,717,000 22,536,000 23,259,000 Cash Flow All numbers in thousands Get access to 40+ years of historical data with Yahoo Finance Premium. Learn more TTM 5/31/2019 4,996,000 5.903.000 -279.000 -264,000 Breakdown > Cash flows from operating activ... > Cash flows from investing activi... > Cash flows from financing activ... Net change in cash Cash at beginning of period Cash at end of period -4,471.000 -5,293.000 164,000 217,000 3,282,000 4,249,000 3,528,000 4,466,000 > Free Cash Flow 3.936.000 4,784,000 Adidas Financial Information Breakdown TTM 12/31/2019 Total Revenue 22,498,000 23,640,000 10.626,000 11,347,000 11,873,000 12,293,000 9.295,000 9,620,000 2.578,000 2.673,000 Cost of Revenue Gross Profit > Operating Expenses Operating Income or Loss Interest Expense Income Before Tax Income Tax Expense Income from Continuing Operations Net Income 97,000 160,000 2,508,000 2.558,000 666,000 640,000 1,842.000 1,918.000 1,929.000 1,976,000 1,929,000 1,976.000 Net Income available to commons... Basic EPS 5.00 5.00 Diluted EPS Basic Average Shares 395,212 Diluted Average Shares 395,212 EBITDA 3,932,000 Additional Adidas Financial Information Balance Sheet Currency in EUR. All numbers in thousands Get access to 40+ years of historical data with Yahoo Finance Premium. Learn more Breakdown 12/31/2019 12/31/2018 12/31/2017 > Assets 20.680,000 15,612,000 14,522,000 > Liabilities and stockholders' eq... 20,680,000 15,612,000 14,522,000 Cash Flow Currency in EUR. All numbers in thousands Get access to 40+ years of historical data with Yahoo Finance Premium. Learn more TTM 12/31/2019 2,796,000 2,819.000 -716,000 -925,000 Breakdown > Cash flows from operating activ... > Cash flows from investing activi.. Net change in cash Cash at beginning of period Cash at end of period 1,142,000 - 410,000 1.313,000 2,629,000 2,505.000 2,220,000 > Free Cash Flow 2.104,000 2,111,000