COMPLETE AND ACCURATE RESPONSES WILL BE THUMBED UP PROMPTLY, THANK YOU!
REFERENCE THE MATERIAL BELOW FOR YOUR ANSWER:
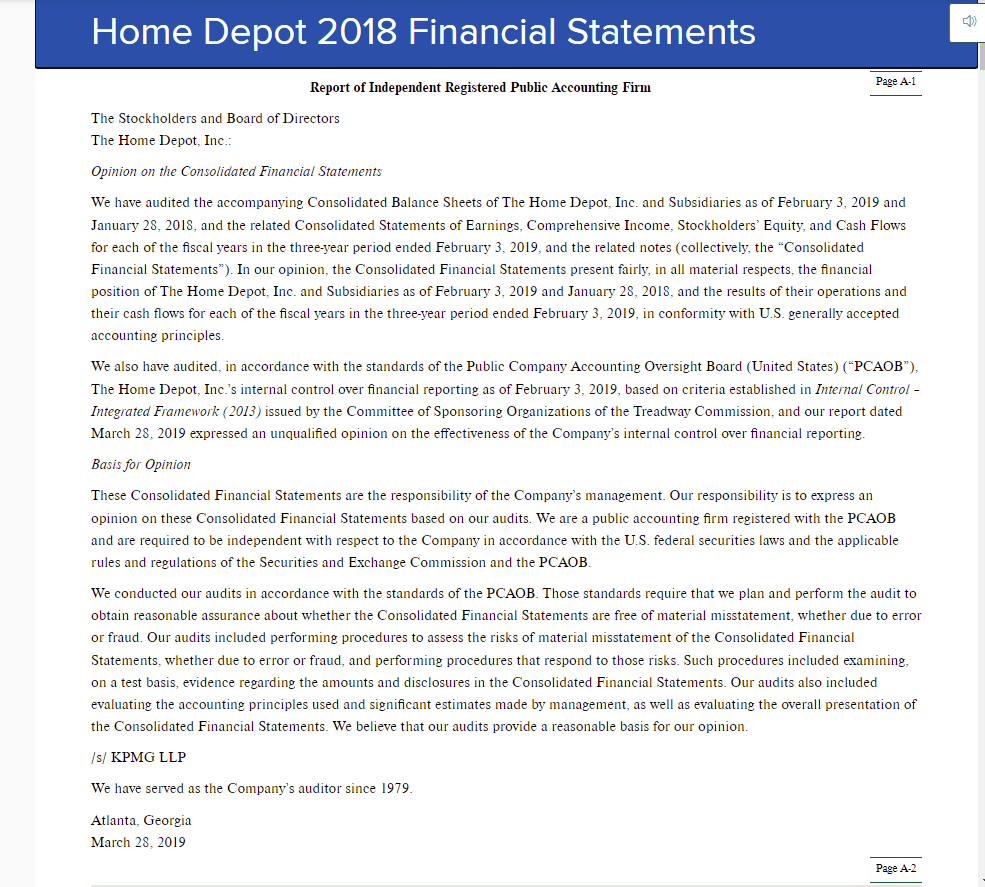
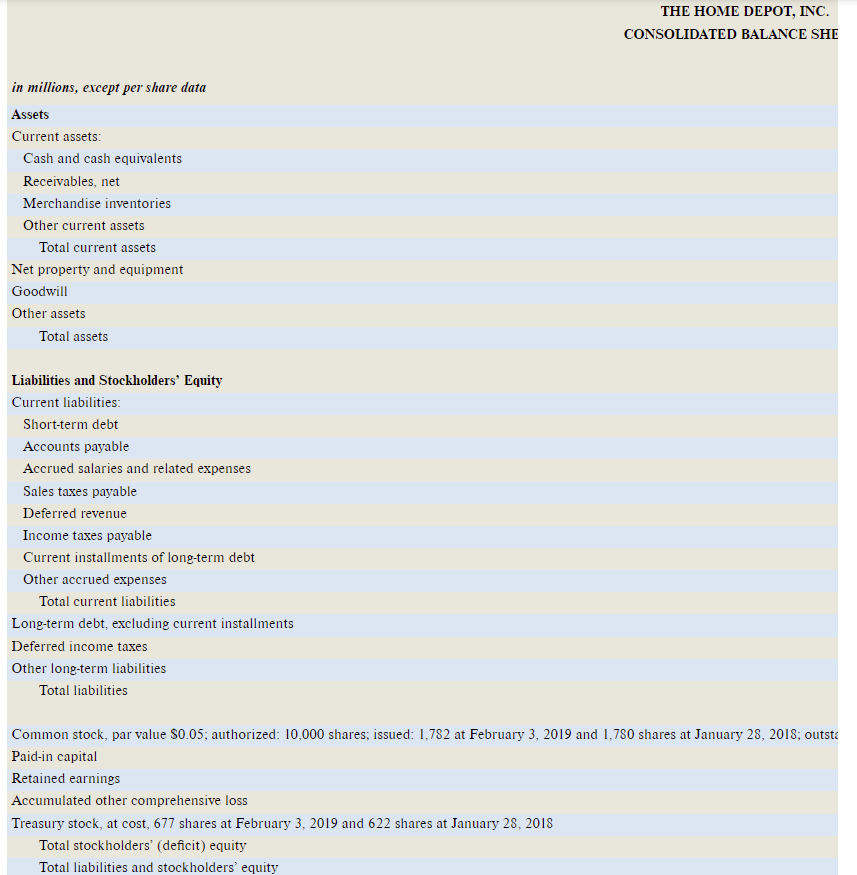
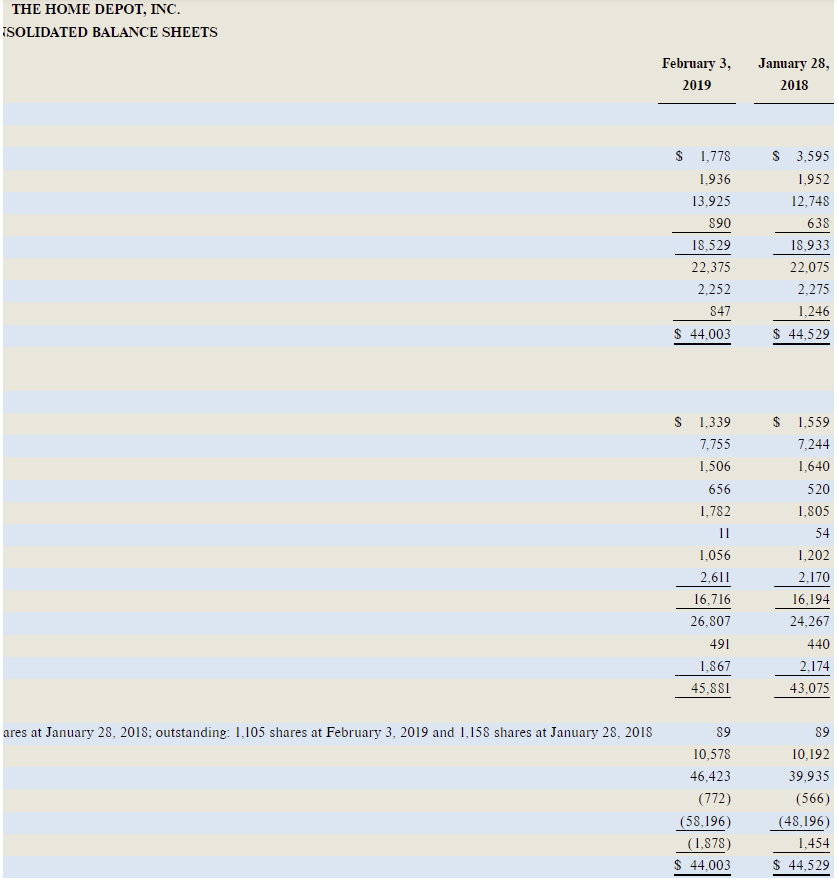
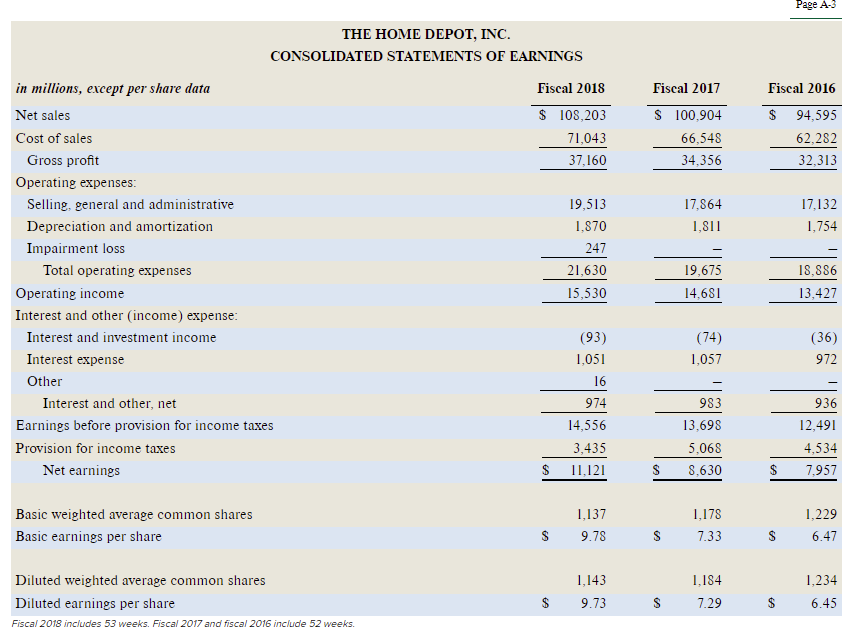

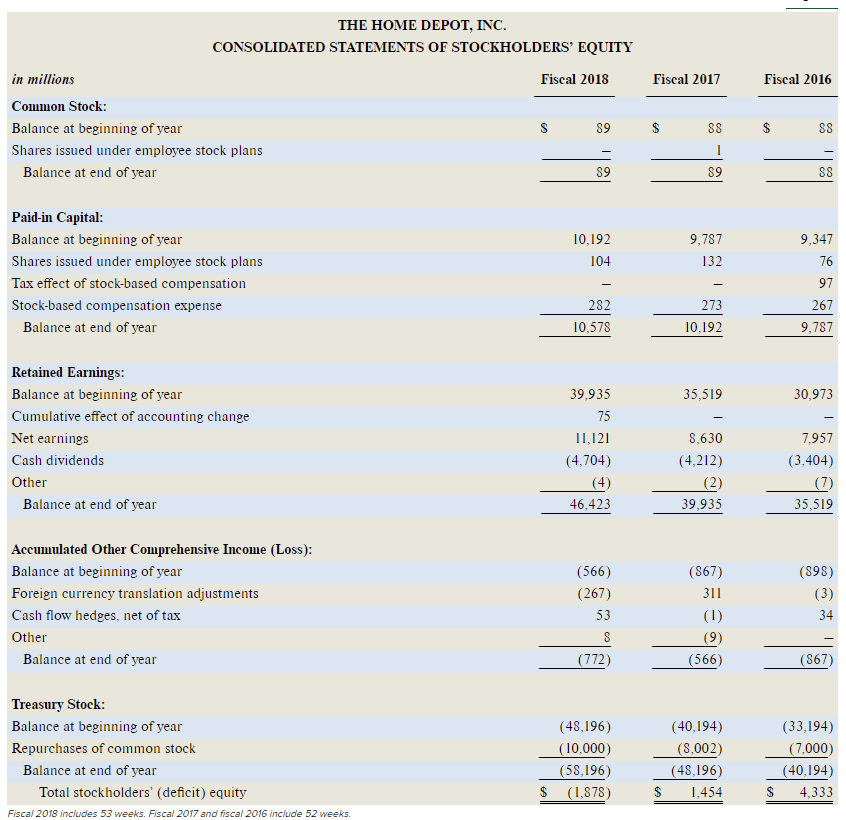
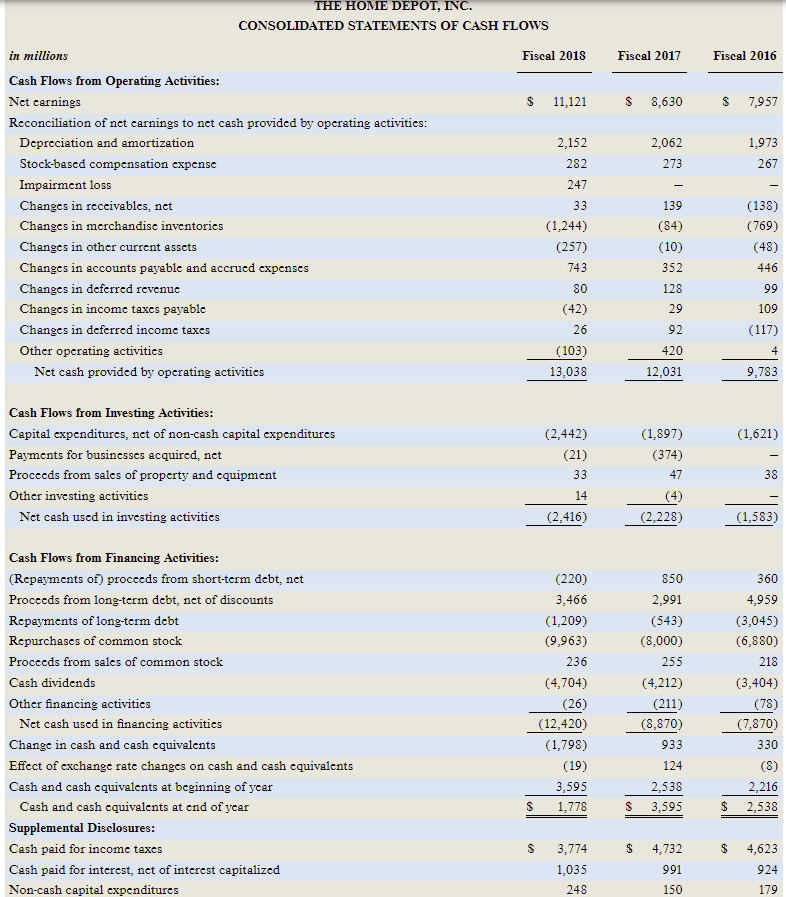
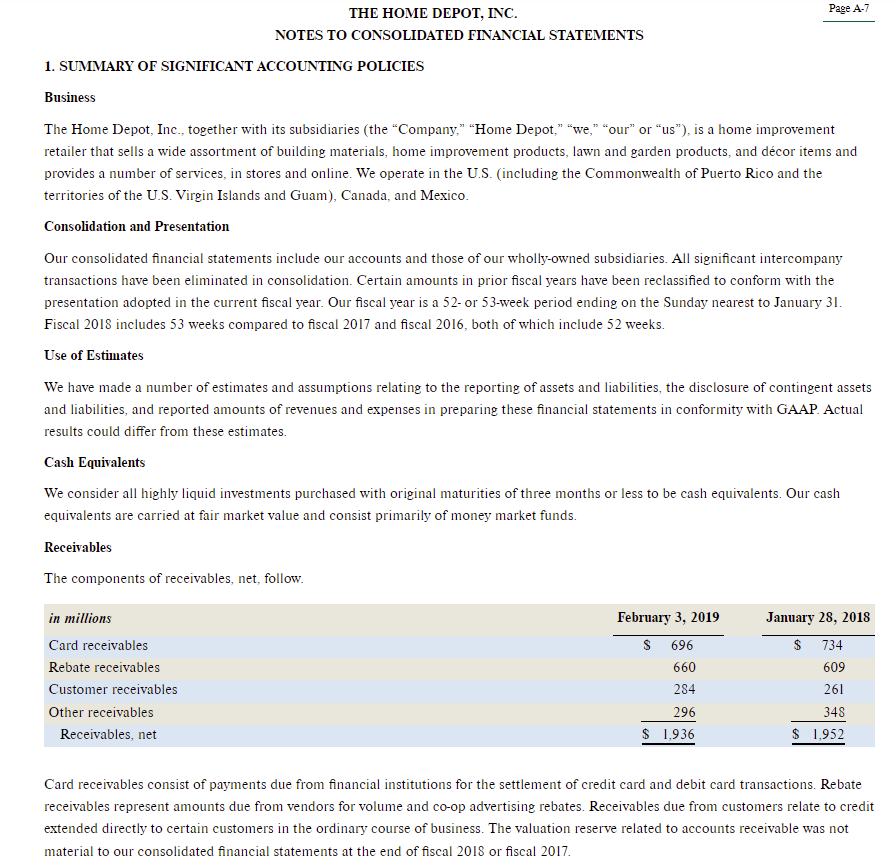
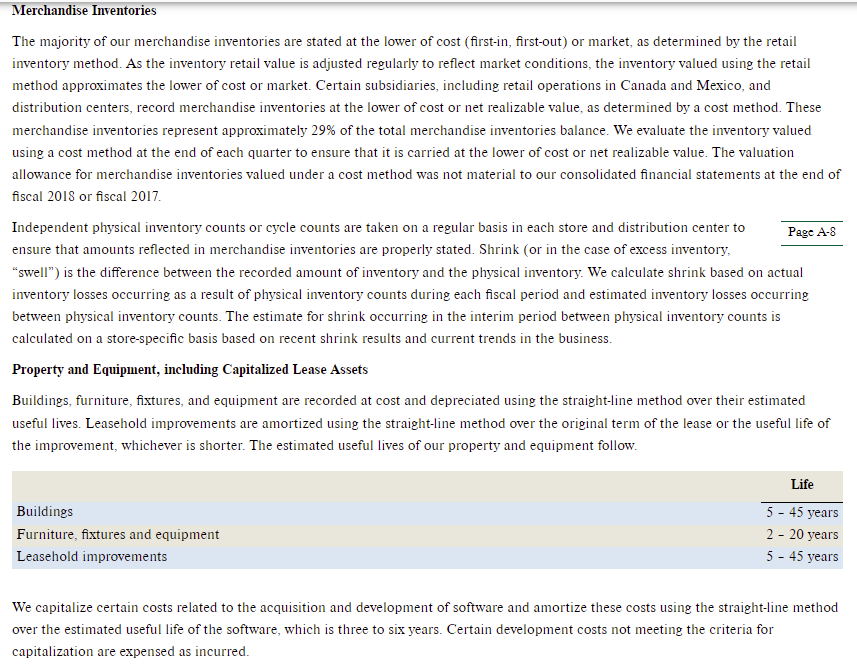
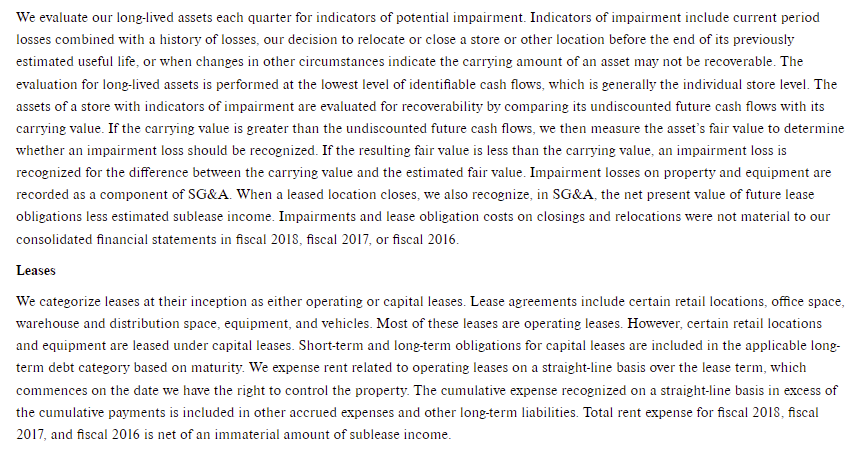
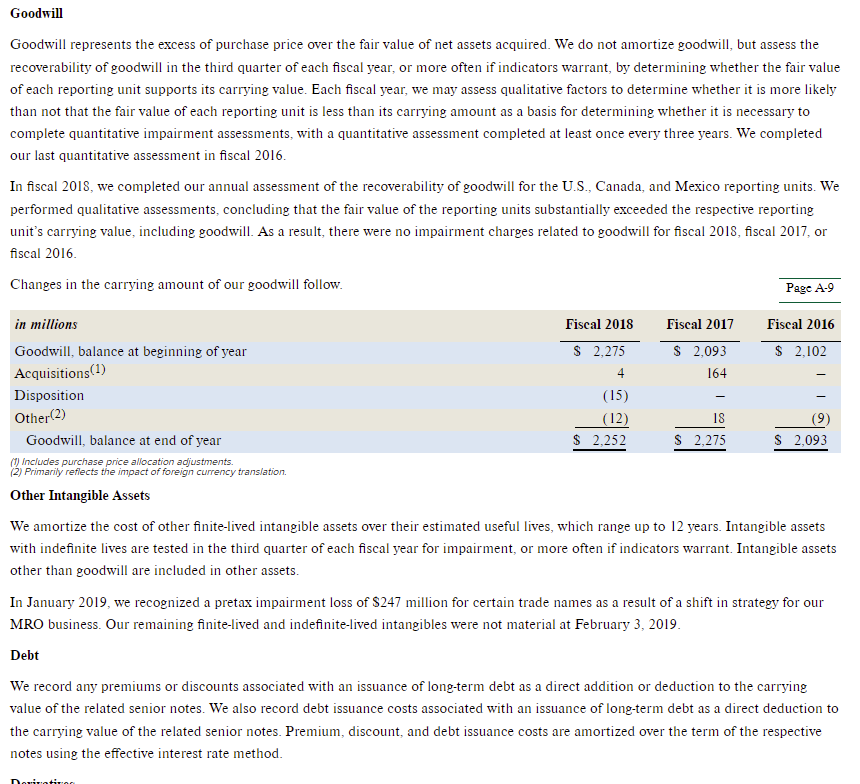
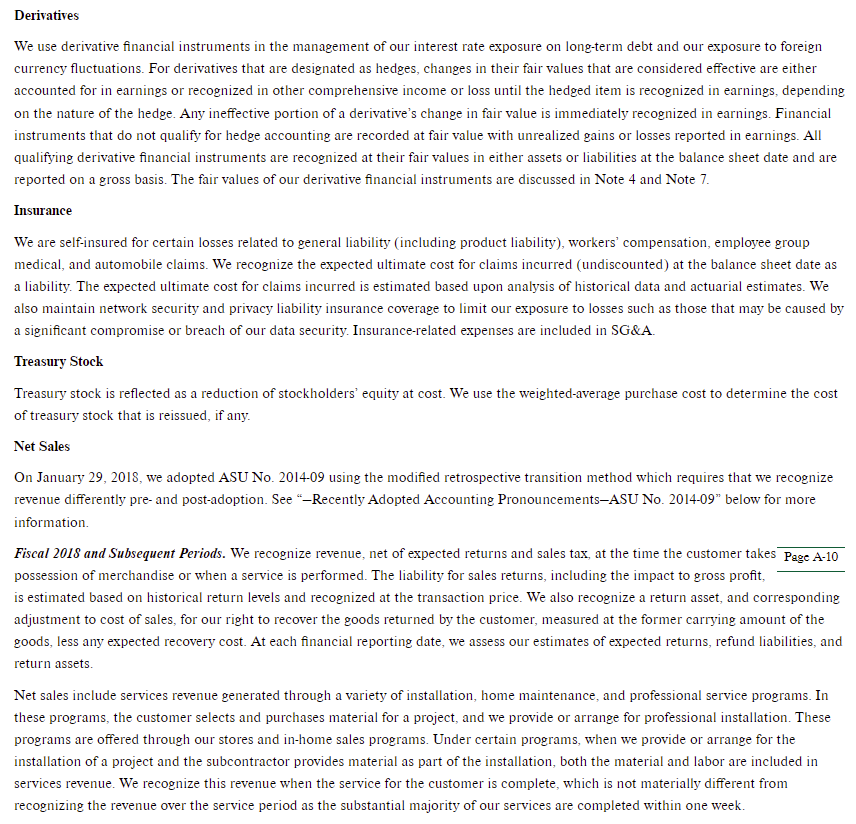
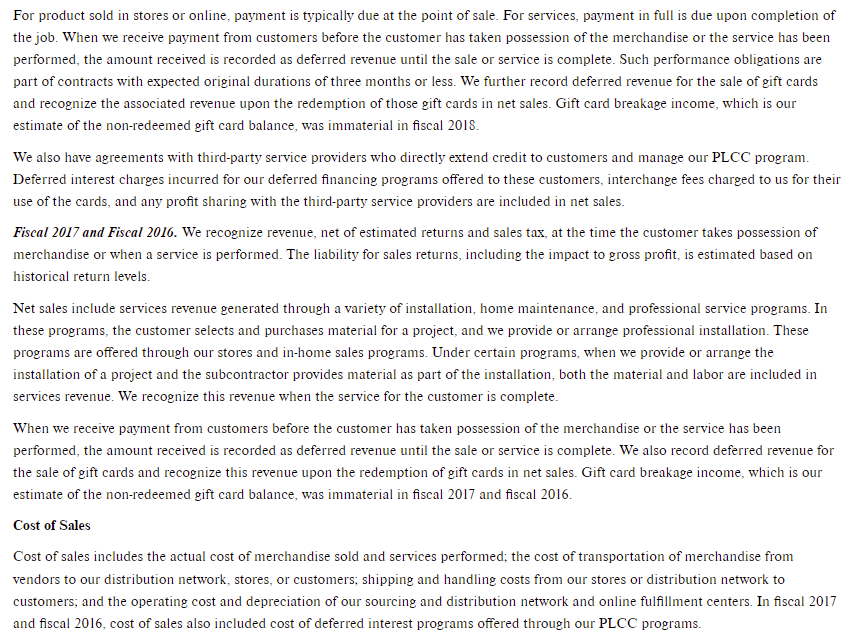
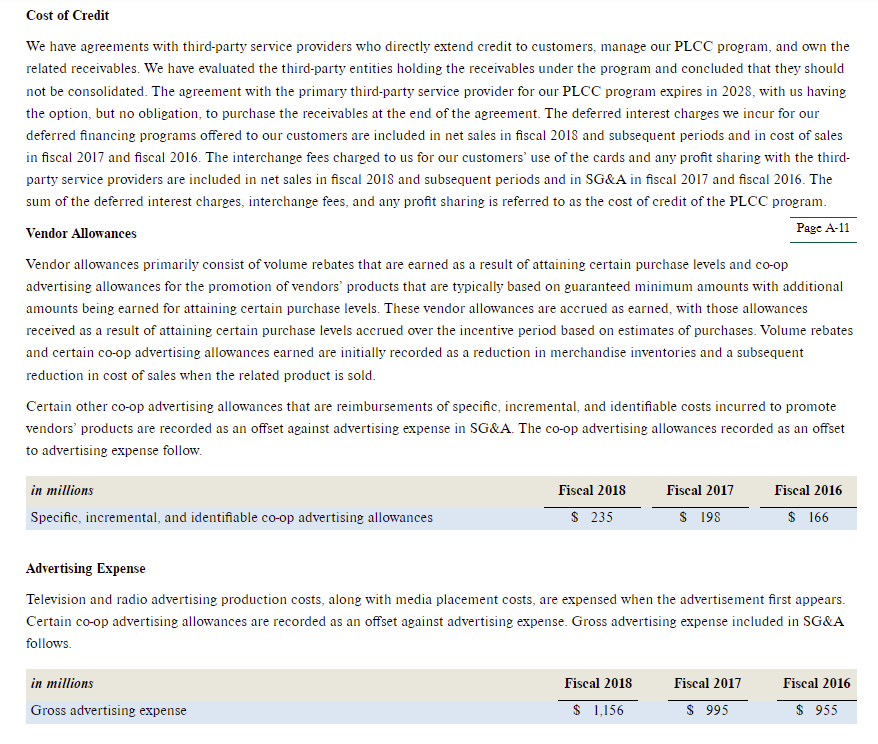
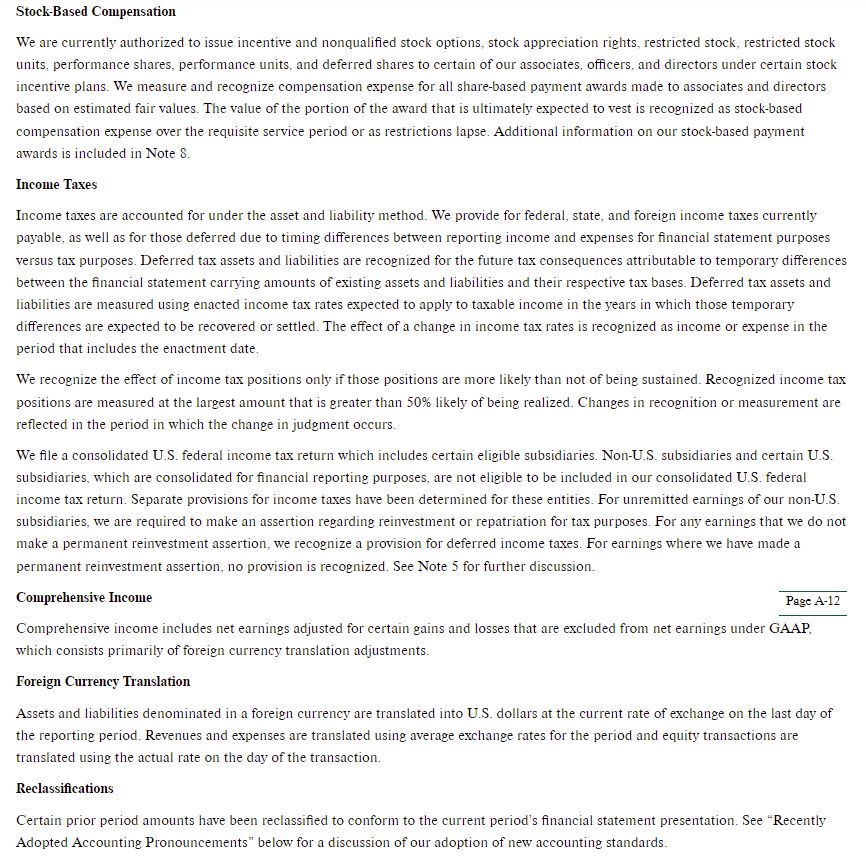
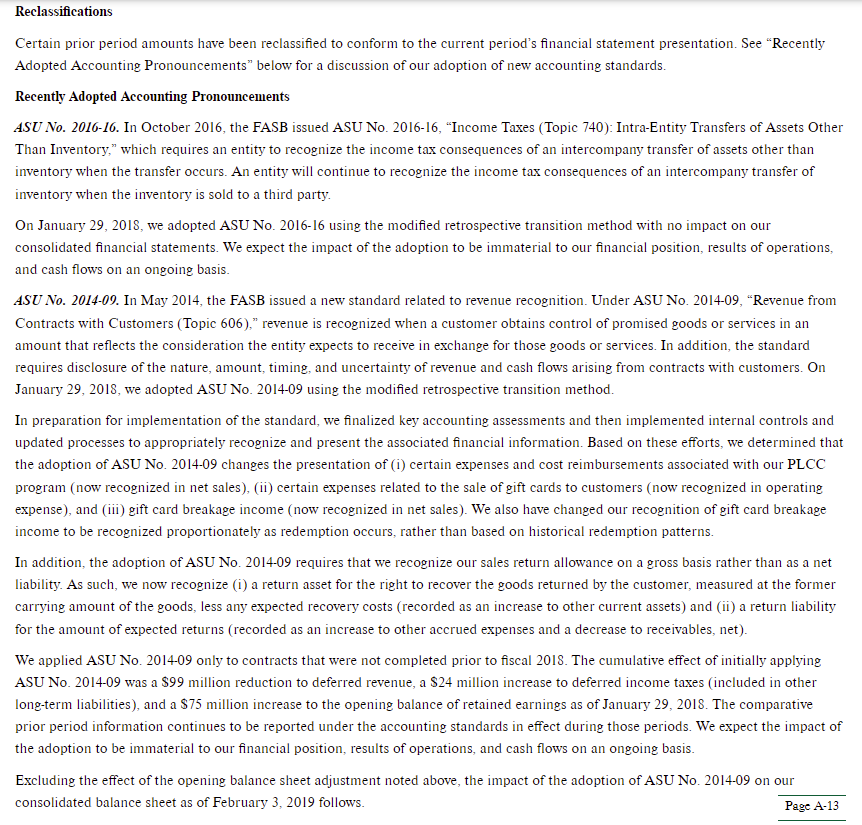
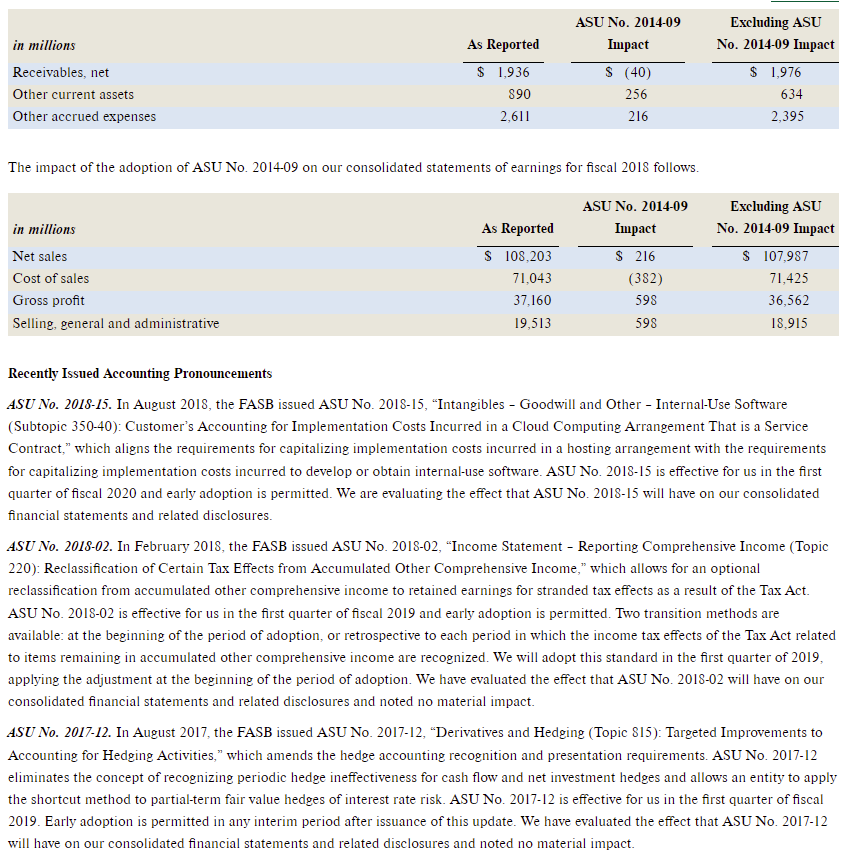
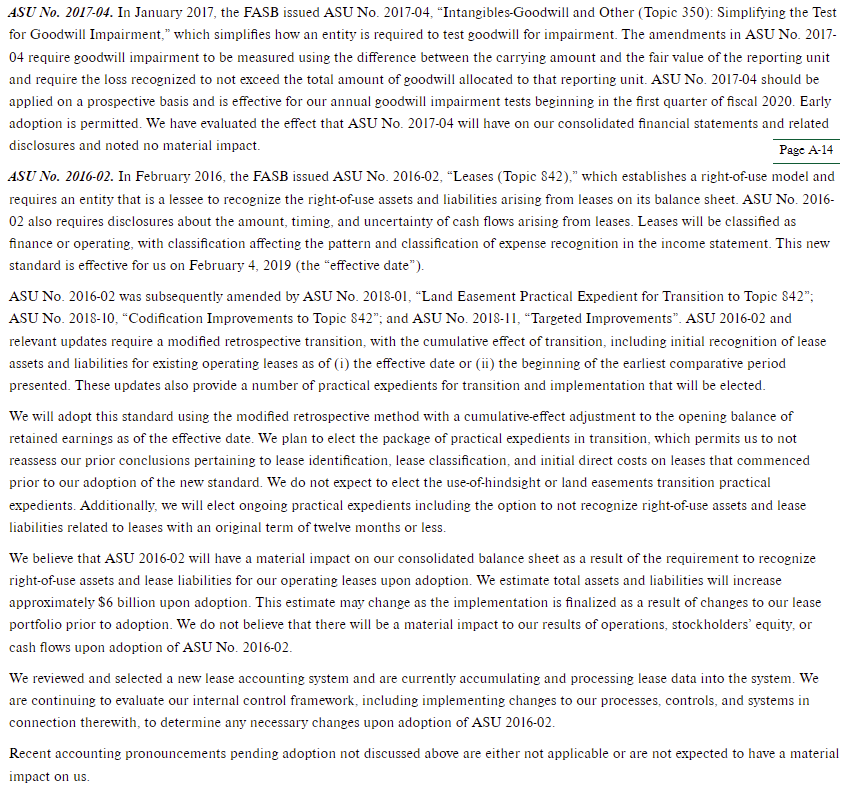
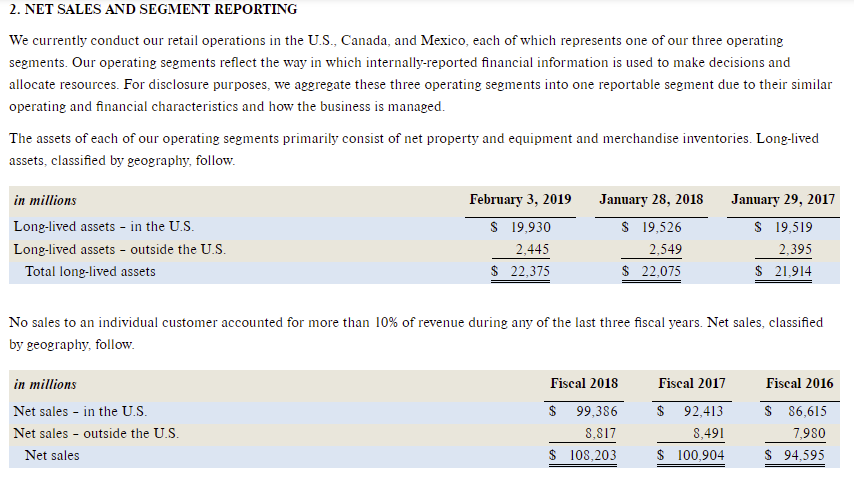
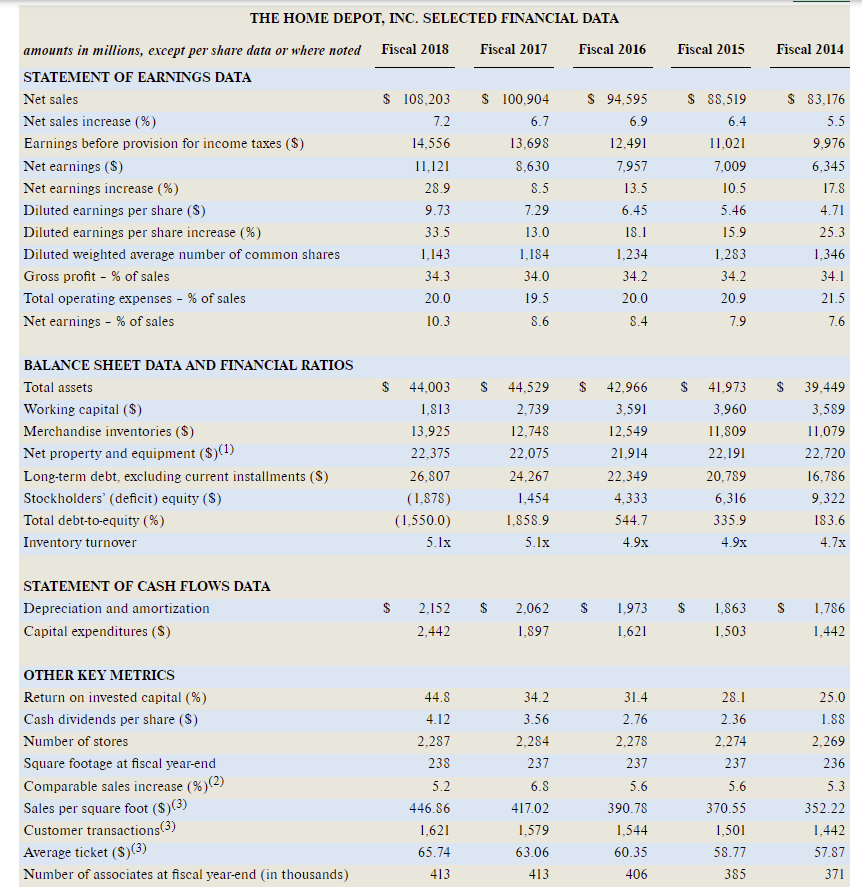
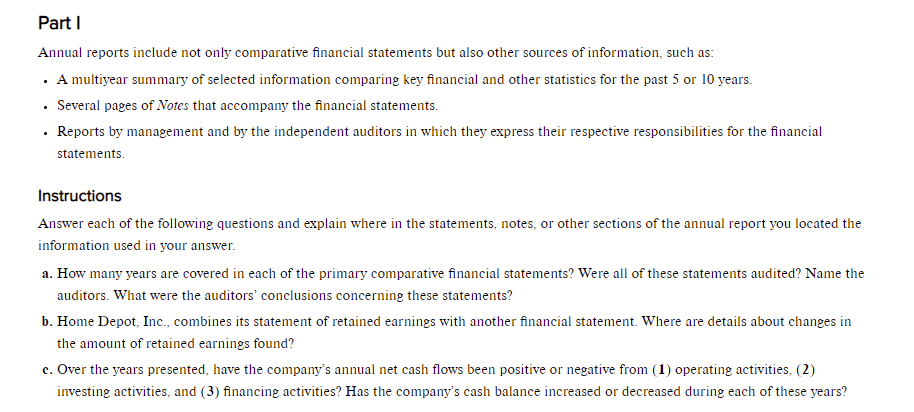
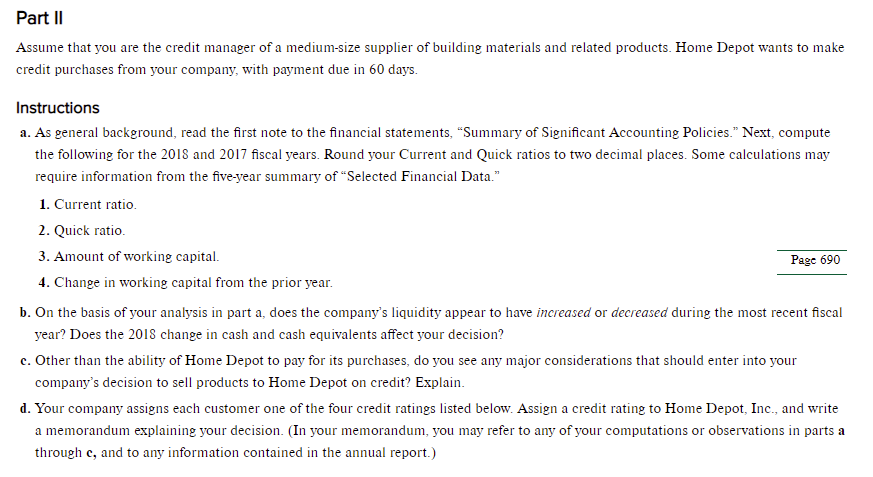
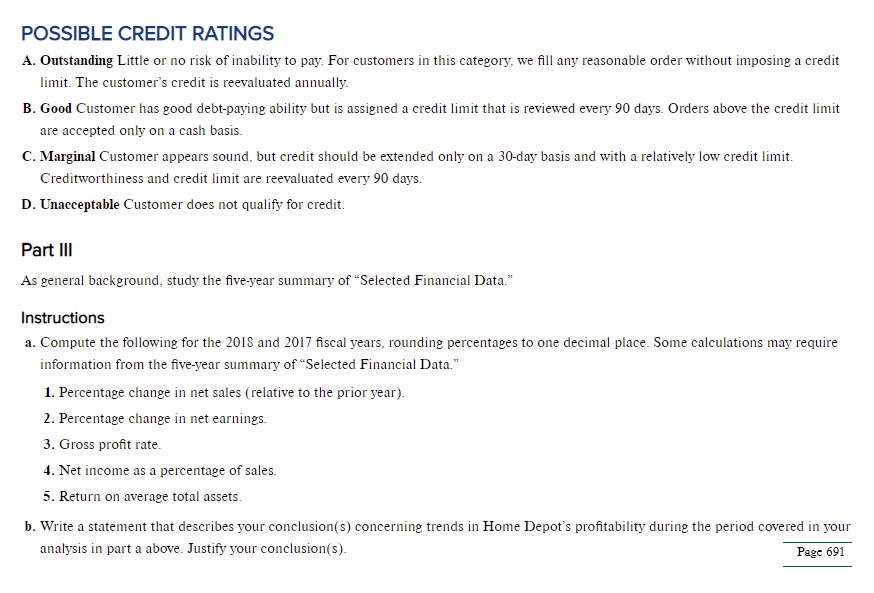
Part 1 Annual reports include not only comparative financial statements but also other sources of information, such as: A multiyear summary of selected information comparing key financial and other statistics for the past 5 or 10 years. . Several pages of Notes that accompany the financial statements. Reports by management and by the independent auditors in which they express their respective responsibilities for the financial statements. Instructions Answer each of the following questions and explain where in the statements, notes, or other sections of the annual report you located the information used in your answer. a. How many years are covered in each of the primary comparative financial statements? Were all of these statements audited? Name the auditors. What were the auditors' conclusions concerning these statements? b. Home Depot, Inc., combines its statement of retained earnings with another financial statement. Where are details about changes in the amount of retained earnings found? c. Over the years presented, have the company's annual net cash flows been positive or negative from (1) operating activities, (2) investing activities, and (3) financing activities? Has the company's cash balance increased or decreased during each of these years? Part II Assume that you are the credit manager of a medium-size supplier of building materials and related products. Home Depot wants to make credit purchases from your company, with payment due in 60 days. Instructions a. As general background, read the first note to the financial statements, "Summary of Significant Accounting Policies." Next, compute the following for the 2018 and 2017 fiscal years. Round your Current and Quick ratios to two decimal places. Some calculations may require information from the five-year summary of Selected Financial Data." 1. Current ratio. 2. Quick ratio 3. Amount of working capital. Page 690 4. Change in working capital from the prior year. b. On the basis of your analysis in part a, does the company's liquidity appear to have increased or decreased during the most recent fiscal year? Does the 2018 change in cash and cash equivalents affect your decision? c. Other than the ability of Home Depot to pay for its purchases, do you see any major considerations that should enter into your company's decision to sell products to Home Depot on credit? Explain. d. Your company assigns each customer one of the four credit ratings listed below. Assign a credit rating to Home Depot, Inc., and write a memorandum explaining your decision. (In your memorandum, you may refer to any of your computations or observations in parts a through c, and to any information contained in the annual report.) c, POSSIBLE CREDIT RATINGS A. Outstanding Little or no risk of inability to pay. For customers in this category, we fill any reasonable order without imposing a credit limit. The customer's credit is reevaluated annually B. Good Customer has good debt-paying ability but is assigned a credit limit that is reviewed every 90 days. Orders above the credit limit are accepted only on a cash basis. C. Marginal Customer appears sound, but credit should be extended only on a 30-day basis and with a relatively low credit limit. Creditworthiness and credit limit are reevaluated every 90 days. D. Unacceptable Customer does not qualify for credit. Part III As general background, study the five-year summary of "Selected Financial Data." Instructions a. Compute the following for the 2018 and 2017 fiscal years, rounding percentages to one decimal place. Some calculations may require information from the five-year summary of "Selected Financial Data." 1. Percentage change in net sales (relative to the prior year). 2. Percentage change in net earnings. 3. Gross profit rate 4. Net income as a percentage of sales. 5. Return on average total assets. b. Write a statement that describes your conclusion(s) concerning trends in Home Depot's profitability during the period covered in your analysis in part a above. Justify your conclusion(s). Page 691 c) Home Depot 2018 Financial Statements Page A-1 Report of Independent Registered Public Accounting Firm The Stockholders and Board of Directors The Home Depot, Inc.: Opinion on the Consolidated Financial Statements We have audited the accompanying Consolidated Balance Sheets of The Home Depot, Inc. and Subsidiaries as of February 3, 2019 and January 28, 2018, and the related Consolidated Statements of Earnings, Comprehensive Income, Stockholders' Equity, and Cash Flows for each of the fiscal years in the three-year period ended February 3, 2019, and the related notes (collectively, the Consolidated Financial Statements"). In our opinion, the Consolidated Financial Statements present fairly, in all material respects, the financial position of The Home Depot, Inc. and Subsidiaries as of February 3, 2019 and January 28, 2018, and the results of their operations and their cash flows for each of the fiscal years in the three-year period ended February 3, 2019, in conformity with U.S. generally accepted accounting principles. We also have audited, in accordance with the standards of the Public Company Accounting Oversight Board (United States) ("PCAOB"), The Home Depot, Inc.'s internal control over financial reporting as of February 3, 2019, based on criteria established in Internal Control - Integrated Framework (2013) issued by the Committee of Sponsoring Organizations of the Treadway Commission, and our report dated March 28, 2019 expressed an unqualified opinion on the effectiveness of the Company's internal control over financial reporting. Basis for Opinion These Consolidated Financial Statements are the responsibility of the Company's management. Our responsibility is to express an opinion on these Consolidated Financial Statements based on our audits. We are a public accounting firm registered with the PCAOB and are required to be independent with respect to the Company in accordance with the U.S. federal securities laws and the applicable rules and regulations of the Securities and Exchange Commission and the PCAOB. We conducted our audits in accordance with the standards of the PCAOB. Those standards require that we plan and perform the audit to obtain reasonable assurance about whether the Consolidated Financial Statements are free of material misstatement, whether due to error or fraud. Our audits included performing procedures to assess the risks of material misstatement of the Consolidated Financial Statements, whether due to error or fraud, and performing procedures that respond to those risks. Such procedures included examining, on a test basis, evidence regarding the amounts and disclosures in the Consolidated Financial Statements. Our audits also included evaluating the accounting principles used and significant estimates made by management, as well as evaluating the overall presentation of the Consolidated Financial Statements. We believe that our audits provide a reasonable basis for our opinion. /s/ KPMG LLP We have served as the Company's auditor since 1979. Atlanta, Georgia March 28, 2019 Page A-2 THE HOME DEPOT, INC. CONSOLIDATED BALANCE SHE in millions, except per share data Assets Current assets: Cash and cash equivalents Receivables, net Merchandise inventories Other current assets Total current assets Net property and equipment Goodwill Other assets Total assets Liabilities and Stockholders' Equity Current liabilities: Short-term debt Accounts payable Accrued salaries and related expenses Sales taxes payable Deferred revenue Income taxes payable Current installments of long-term debt Other accrued expenses Total current liabilities Long-term debt, excluding current installments Deferred income taxes Other long-term liabilities Total liabilities Common stock, par value 50.05; authorized: 10,000 shares, issued: 1,782 at February 3, 2019 and 1,780 shares at January 28, 2018, outsta Paid-in capital Retained earnings Accumulated other comprehensive loss Treasury stock, at cost, 677 shares at February 3, 2019 and 622 shares at January 28, 2018 Total stockholders' (deficit) equity Total liabilities and stockholders' equity THE HOME DEPOT, INC. TSOLIDATED BALANCE SHEETS February 3, 2019 January 28, 2018 S 1,778 1.936 13.925 890 18,529 22,375 2.252 847 $ 44,003 $ 3,595 1,952 12,748 638 18,933 22,075 2.275 1,246 $ 44,529 $ 1,339 7,755 1,506 656 1,782 11 1,056 2,611 16,716 26,807 491 1.867 45,881 1,559 7,244 1,640 520 1,805 54 1,202 2,170 16,194 24,267 440 2.174 43.075 ares at January 28, 2018, outstanding: 1,105 shares at February 3, 2019 and 1,158 shares at January 28, 2018 89 10,578 46,423 (772) (58,196) (1,878) $ 44,003 89 10,192 39,935 (566) (48,196) 1,454 $ 44,529 Page A3 Fiscal 2017 $ 100,904 66,548 34,356 Fiscal 2016 $ 94,595 62,282 32,313 17,864 1,811 17,132 1,754 THE HOME DEPOT, INC. CONSOLIDATED STATEMENTS OF EARNINGS in millions, except per share data Fiscal 2018 Net sales $ 108,203 Cost of sales 71,043 Gross profit 37,160 Operating expenses: Selling general and administrative 19,513 Depreciation and amortization 1.870 Impairment loss 247 Total operating expenses 21,630 Operating income 15,530 Interest and other income) expense: Interest and investment income (93) Interest expense 1,051 Other 16 Interest and other, net 974 Earnings before provision for income taxes 14,556 Provision for income taxes 3,435 Net earnings $ 11.121 19,675 14,681 18.886 13,427 (74) 1,057 (36) 972 983 13,698 5.068 8.630 936 12,491 4,534 7.957 $ $ Basic weighted average common shares Basic earnings per share 1,137 9.78 1,178 7.33 1.229 6.47 S S S Diluted weighted average common shares Diluted earnings per share 1,143 9.73 1,184 7.29 1,234 6.45 GA S $ Fiscal 2018 includes 53 weeks. Fiscal 2017 and fiscal 2016 include 52 weeks. THE HOME DEPOT, INC. CONSOLIDATED STATEMENTS OF COMPREHENSIVE INCOME Fiscal 2018 Fiscal 2017 Fiscal 2016 $ 11,121 $ 8,630 $ 7,957 in millions Net earnings Other comprehensive (loss) income: Foreign currency translation adjustments Cash flow hedges, net of tax Other Total other comprehensive (loss) income Comprehensive income Fiscal 2018 includes 53 weeks. Fiscal 2017 and fiscal 2016 include 52 weeks. See accompanying notes to consolidated financial statements. (3) 34 (267) 53 8 (206) $ 10,915 311 (1) (9) 301 $ 8,931 31 $ 7,988 THE HOME DEPOT, INC. CONSOLIDATED STATEMENTS OF STOCKHOLDERS' EQUITY Fiscal 2018 Fiscal 2017 Fiscal 2016 in millions Common Stock: Balance at beginning of year Shares issued under employee stock plans Balance at end of year $ 89 $ 88 $ 88 89 89 88 10.192 104 9,787 132 Paid-in Capital: Balance at beginning of year Shares issued under employee stock plans Tax effect of stock-based compensation Stock-based compensation expense Balance at end of year 9,347 76 97 282 10,578 273 10,192 267 9,787 35,519 30,973 Retained Earnings: Balance at beginning of year Cumulative effect of accounting change Net earnings Cash dividends Other Balance at end of year 39,935 75 11,121 (4,704) (4) 46,423 8,630 (4,212) (2) 39,935 7,957 (3,404) (7) 35,519 Accumulated Other Comprehensive Income (Loss): Balance at beginning of year Foreign currency translation adjustments Cash flow hedges, net of tax Other Balance at end of year (566) (267) 53 8 (772) (867) 311 (1) (9) (566) (898) (3) 34 (867) Treasury Stock: Balance at beginning of year Repurchases of common stock Balance at end of year Total stockholders' (deficit) equity Fiscal 2018 includes 53 weeks. Fiscal 2017 and fiscal 2016 include 52 weeks. (48,196) (10,000) (58,196) (1,878) (40,194) (8,002) (48,196) 1,454 (33,194) (7,000) (40,194) 4,333 $ $ $ THE HOME DEPOT, INC. CONSOLIDATED STATEMENTS OF CASH FLOWS Fiscal 2018 Fiscal 2017 Fiscal 2016 $ 11,121 $ 8,630 S 7,957 2,152 282 2,062 273 1.973 267 247 33 139 in millions Cash Flows from Operating Activities: Net earnings Reconciliation of net earnings to net cash provided by operating activities: Depreciation and amortization Stock-based compensation expense Impairment loss Changes in receivables, net Changes in merchandise inventories Changes in other current assets Changes in accounts payable and accrued expenses Changes in deferred revenue Changes in income taxes payable Changes in deferred income taxes Other operating activities Net cash provided by operating activities (1,244) (257) 743 (84) (10) 352 (138) (769) (48) 446 80 128 99 29 109 92 (117) (42) 26 (103) 13,038 420 12,031 9,783 (1,621) Cash Flows from Investing Activities: Capital expenditures, net of non-cash capital expenditures Payments for businesses acquired, net Proceeds from sales of property and equipment Other investing activities Net cash used in investing activities (2,442) (21) 33 (1,897) (374) 47 (4) (2,228) 38 14 (2,416) (1,583) 850 360 Cash Flows from Financing Activities: (Repayments of) proceeds from short-term debt, net Proceeds from long-term debt, net of discounts Repayments of long-term debt Repurchases of common stock Proceeds from sales of common stock Cash dividends Other financing activities Net cash used in financing activities Change in cash and cash equivalents Effect of exchange rate changes on cash and cash equivalents Cash and cash equivalents at beginning of year Cash and cash equivalents at end of year Supplemental Disclosures: Cash paid for income taxes Cash paid for interest, net of interest capitalized Non-cash capital expenditures (220) 3,466 (1,209) (9,963) 236 (4,704) (26) (12,420) (1,798) (19) 3,595 1,778 2,991 (543) (8,000) 255 (4,212) (211) (8,870) 933 4,959 (3,045) (6,880) 218 (3,404) (78) (7.870) 330 124 (8) 2.538 3,595 2,216 2,538 S S $ S S $ 3,774 1,035 248 4,732 991 4,623 924 150 179 THE HOME DEPOT, INC. Page A-7 NOTES TO CONSOLIDATED FINANCIAL STATEMENTS 1. SUMMARY OF SIGNIFICANT ACCOUNTING POLICIES Business The Home Depot, Inc., together with its subsidiaries (the "Company, Home Depot," "we," sour or us), is a home improvement retailer that sells a wide assortment of building materials, home improvement products, lawn and garden products, and dcor items and provides a number of services, in stores and online. We operate in the U.S. (including the Commonwealth of Puerto Rico and the territories of the U.S. Virgin Islands and Guam), Canada, and Mexico. Consolidation and Presentation Our consolidated financial statements include our accounts and those of our wholly-owned subsidiaries. All significant intercompany transactions have been eliminated in consolidation. Certain amounts in prior fiscal years have been reclassified to conform with the presentation adopted in the current fiscal year. Our fiscal year is a 52- or 53-week period ending on the Sunday nearest to January 31. Fiscal 2018 includes 53 weeks compared to fiscal 2017 and fiscal 2016, both of which include 52 weeks. Use of Estimates We have made a number of estimates and assumptions relating to the reporting of assets and liabilities, the disclosure of contingent asse and liabilities, and reported amounts of revenues and expenses in preparing these financial statements in conformity with GAAP. Actual results could differ from these estimates. Cash Equivalents We consider all highly liquid investments purchased with original maturities of three months or less to be cash equivalents. Our cash equivalents are carried at fair market value and consist primarily of money market funds. Receivables The components of receivables, net, follow. in millions Card receivables Rebate receivables Customer receivables Other receivables Receivables, net February 3, 2019 S 696 660 284 296 $ 1,936 January 28, 2018 $ 734 609 261 348 $ 1,952 Card receivables consist of payments due from financial institutions for the settlement of credit card and debit card transactions. Rebate receivables represent amounts due from vendors for volume and co-op advertising rebates. Receivables due from customers relate to credit extended directly to certain customers in the ordinary course of business. The valuation reserve related to accounts receivable was not material to our consolidated financial statements at the end of fiscal 2018 or fiscal 2017. Merchandise Inventories The majority of our merchandise inventories are stated at the lower of cost (first-in, first-out) or market, as determined by the retail inventory method. As the inventory retail value is adjusted regularly to reflect market conditions, the inventory valued using the retail method approximates the lower of cost or market. Certain subsidiaries, including retail operations in Canada and Mexico, and distribution centers, record merchandise inventories at the lower of cost or net realizable value, as determined by a cost method. These merchandise inventories represent approximately 29% of the total merchandise inventories balance. We evaluate the inventory valued using a cost method at the end of each quarter to ensure that it is carried at the lower of cost or net realizable value. The valuation allowance for merchandise inventories valued under a cost method was not material to our consolidated financial statements at the end of fiscal 2018 or fiscal 2017. Independent physical inventory counts or cycle counts are taken on a regular basis in each store and distribution center to Page A-8 ensure that amounts reflected in merchandise inventories are properly stated. Shrink (or in the case of excess inventory, "swell") is the difference between the recorded amount of inventory and the physical inventory. We calculate shrink based on actual inventory losses occurring as a result of physical inventory counts during each fiscal period and estimated inventory losses occurring between physical inventory counts. The estimate for shrink occurring in the interim period between physical inventory counts is calculated on a store-specific basis based on recent shrink results and current trends in the business. Property and Equipment, including Capitalized Lease Assets Buildings, furniture, fixtures, and equipment are recorded at cost and depreciated using the straight-line method over their estimated useful lives. Leasehold improvements are amortized using the straight-line method over the original term of the lease or the useful life of the improvement, whichever is shorter. The estimated useful lives of our property and equipment follow. Life Buildings Furniture, fixtures and equipment Leasehold improvements 5 - 45 years 2 - 20 years 5 - 45 years We capitalize certain costs related to the acquisition and development of software and amortize these costs using the straight-line method over the estimated useful life of the software, which is three to six years. Certain development costs not meeting the criteria for capitalization are expensed as incurred. We evaluate our long-lived assets each quarter for indicators of potential impairment. Indicators of impairment include current period losses combined with a history of losses, our decision to relocate or close a store or other location before the end of its previously estimated useful life, or when changes in other circumstances indicate the carrying amount of an asset may not be recoverable. The evaluation for long-lived assets is performed at the lowest level of identifiable cash flows, which is generally the individual store level. The assets of a store with indicators of impairment are evaluated for recoverability by comparing its undiscounted future cash flows with its carrying value. If the carrying value is greater than the undiscounted future cash flows, we then measure the asset's fair value to determine whether an impairment loss should be recognized. If the resulting fair value is less than the carrying value, an impairment loss is recognized for the difference between the carrying value and the estimated fair value. Impairment losses on property and equipment are recorded as a component of SG&A. When a leased location closes, we also recognize, in SG&A, the net present value of future lease obligations less estimated sublease income. Impairments and lease obligation costs on closings and relocations were not material to our consolidated financial statements in fiscal 2018, fiscal 2017, or fiscal 2016. Leases We categorize leases at their inception as either operating or capital leases. Lease agreements include certain retail locations, office space, warehouse and distribution space, equipment, and vehicles. Most of these leases are operating leases. However, certain retail locations and equipment are leased under capital leases. Short-term and long-term obligations for capital leases are included in the applicable long- term debt category based on maturity. We expense rent related to operating leases on a straight-line basis over the lease term, which commences on the date we have the right to control the property. The cumulative expense recognized on a straight-line basis in excess of the cumulative payments is included in other accrued expenses and other long-term liabilities. Total rent expense for fiscal 2018, fiscal 2017, and fiscal 2016 is net of an immaterial amount of sublease income. Goodwill Goodwill represents the excess of purchase price over the fair value of net assets acquired. We do not amortize goodwill, but assess the recoverability of goodwill in the third quarter of each fiscal year, or more often if indicators warrant, by determining whether the fair value of each reporting unit supports its carrying value. Each fiscal year, we may assess qualitative factors to determine whether it is more likely than not that the fair value of each reporting unit is less than its carrying amount as a basis for determining whether it is necessary to complete quantitative impairment assessments, with a quantitative assessment completed at least once every three years. We completed our last quantitative assessment in fiscal 2016. In fiscal 2018, we completed our annual assessment of the recoverability of goodwill for the U.S., Canada, and Mexico reporting units. We performed qualitative assessments, concluding that the fair value of the reporting units substantially exceeded the respective reporting unit's carrying value, including goodwill. As a result, there were no impairment charges related to goodwill for fiscal 2018, fiscal 2017, or fiscal 2016 Changes in the carrying amount of our goodwill follow. Page A-9 4 in millions Fiscal 2018 Fiscal 2017 Fiscal 2016 Goodwill, balance at beginning of year $ 2,275 $ 2,093 $ 2,102 Acquisitions(1) 164 Disposition (15) Other(2) (12) 18 (9) Goodwill, balance at end of year $ 2.252 $ 2,275 $ 2,093 (1) Includes purchase price allocation adjustments. (2) Primarily reflects the impact of foreign currency translation Other Intangible Assets We amortize the cost of other finite-lived intangible assets over their estimated useful lives, which range up to 12 years. Intangible assets with indefinite lives are tested in the third quarter of each fiscal year for impairment, or more often if indicators warrant. Intangible assets other than goodwill are included in other assets. In January 2019, we recognized a pretax impairment loss of S247 million for certain trade names as a result of a shift in strategy for our MRO business. Our remaining finite-lived and indefinite-lived intangibles were not material at February 3, 2019. Debt We record any premiums or discounts associated with an issuance of long-term debt as a direct addition or deduction to the carrying value of the related senior notes. We also record debt issuance costs associated with an issuance of long-term debt as a direct deduction to the carrying value of the related senior notes. Premium, discount, and debt issuance costs are amortized over the term of the respective notes using the effective interest rate method. Derivatives We use derivative financial instruments in the management of our interest rate exposure on long-term debt and our exposure to foreign currency fluctuations. For derivatives that are designated as hedges, changes in their fair values that are considered effective are either accounted for in earnings or recognized in other comprehensive income or loss until the hedged item is recognized in earnings, depending on the nature of the hedge. Any ineffective portion of a derivative's change in fair value is immediately recognized in earnings. Financial instruments that do not qualify for hedge accounting are recorded at fair value with unrealized gains or losses reported in earnings. All qualifying derivative financial instruments are recognized at their fair values in either assets or liabilities at the balance sheet date and are reported on a gross basis. The fair values of our derivative financial instruments are discussed in Note 4 and Note 7. Insurance We are self-insured for certain losses related to general liability (including product liability), workers' compensation, employee group medical, and automobile claims. We recognize the expected ultimate cost for claims incurred (undiscounted) at the balance sheet date as a liability. The expected ultimate cost for claims incurred is estimated based upon analysis of historical data and actuarial estimates. We also maintain network security and privacy liability insurance coverage to limit our exposure to losses such as those that may be caused by a significant compromise or breach of our data security. Insurance-related expenses are included in SG&A. Treasury Stock Treasury stock is reflected as a reduction of stockholders' equity at cost. We use the weighted average purchase cost to determine the cost of treasury stock that is reissued, if any. Net Sales On January 29, 2018, we adopted ASU No. 2014-09 using the modified retrospective transition method which requires that we recognize revenue differently pre- and post-adoption. See -Recently Adopted Accounting Pronouncements-ASU No. 2014-09" below for more information Fiscal 2018 and Subsequent Periods. We recognize revenue, net of expected returns and sales tax, at the time the customer takes Page A-10 possession of merchandise or when a service is performed. The liability for sales returns, including the impact to gross profit, is estimated based on historical return levels and recognized at the transaction price. We also recognize a return asset, and corresponding adjustment to cost of sales, for our right to recover the goods returned by the customer, measured at the former carrying amount of the goods, less any expected recovery cost. At each financial reporting date, we assess our estimates of expected returns, refund liabilities, and return assets. Net sales include services revenue generated through a variety of installation, home maintenance, and professional service programs. In these programs, the customer selects and purchases material for a project, and we provide or arrange for professional installation. These programs are offered through our stores and in-home sales programs. Under certain programs, when we provide or arrange for the installation of a project and the subcontractor provides material as part of the installation, both the material and labor are included in services revenue. We recognize this revenue when the service for the customer is complete, which is not materially different from recognizing the revenue over the service period as the substantial majority of our services are completed within one week. For product sold in stores or online, payment is typically due at the point of sale. For services, payment in full is due upon completion of the job. When we receive payment from customers before the customer has taken possession of the merchandise or the service has been performed, the amount received is recorded as deferred revenue until the sale or service is complete. Such performance obligations are part of contracts with expected original durations of three months or less. We further record deferred revenue for the sale of gift cards and recognize the associated revenue upon the redemption of those gift cards in net sales. Gift card breakage income, which is our estimate of the non-redeemed gift card balance, was immaterial in fiscal 2018. We also have agreements with third-party service providers who directly extend credit to customers and manage our PLCC program. Deferred interest charges incurred for our deferred financing programs offered to these customers, interchange fees charged to us for their use of the cards, and any profit sharing with the third-party service providers are included in net sales. Fiscal 2017 and Fiscal 2016. We recognize revenue, net of estimated returns and sales tax, at the time the customer takes possession of merchandise or when a service is performed. The liability for sales returns, including the impact to gross profit, is estimated based on historical return levels. Net sales include services revenue generated through a variety of installation, home maintenance and professional service programs. In these programs, the customer selects and purchases material for a project, and we provide or arrange professional installation. These programs are offered through our stores and in-home sales programs. Under certain programs, when we provide or arrange the installation of a project and the subcontractor provides material as part of the installation, both the material and labor are included in services revenue. We recognize this revenue when the service for the customer is complete. When we receive payment from customers before the customer has taken possession of the merchandise or the service has been performed, the amount received is recorded as deferred revenue until the sale or service is complete. We also record deferred revenue for the sale of gift cards and recognize this revenue upon the redemption of gift cards in net sales. Gift card breakage income, which is our estimate of the non-redeemed gift card balance, was immaterial in fiscal 2017 and fiscal 2016. Cost of Sales Cost of sales includes the actual cost of merchandise sold and services performed; the cost of transportation of merchandise from vendors to our distribution network, stores, or customers; shipping and handling costs from our stores or distribution network to customers, and the operating cost and depreciation of our sourcing and distribution network and online fulfillment centers. In fiscal 2017 and fiscal 2016, cost of sales also included cost of deferred interest programs offered through our PLCC programs. Cost of Credit We have agreements with third-party service providers who directly extend credit to customers, manage our PLCC program, and own the related receivables. We have evaluated the third-party entities holding the receivables under the program and concluded that they should not be consolidated. The agreement with the primary third-party service provider for our PLCC program expires in 2028, with us having the option, but no obligation, to purchase the receivables at the end of the agreement. The deferred interest charges we incur for our deferred financing programs offered to our customers are included in net sales in fiscal 2018 and subsequent periods and in cost of sales in fiscal 2017 and fiscal 2016. The interchange fees charged to us for our customers' use of the cards and any profit sharing with the third- party service providers are included in net sales in fiscal 2018 and subsequent periods and in SG&A in fiscal 2017 and fiscal 2016. The sum of the deferred interest charges, interchange fees, and any profit sharing is referred to as the cost of credit of the PLCC program. Vendor Allowances Page A-11 Vendor allowances primarily consist of volume rebates that are earned as a result of attaining certain purchase levels and co-op advertising allowances for the promotion of vendors products that are typically based on guaranteed minimum amounts with additional amounts being earned for attaining certain purchase levels. These vendor allowances are accrued as earned, with those allowances received as a result of attaining certain purchase levels accrued over the incentive period based on estimates of purchases. Volume rebates and certain co-op advertising allowances earned are initially recorded as a reduction in merchandise inventories and a subsequent reduction in cost of sales when the related product is sold. Certain other co-op advertising allowances that are reimbursements of specific, incremental, and identifiable costs incurred to promote vendors' products are recorded as an offset against advertising expense in SG&A. The co-op advertising allowances recorded as an offset to advertising expense follow. in millions Specific incremental, and identifiable co-op advertising allowances Fiscal 2018 $ 235 Fiscal 2017 $ 198 Fiscal 2016 $ 166 Advertising Expense Television and radio advertising production costs, along with media placement costs, are expensed when the advertisement first appears. Certain co-op advertising allowances are recorded as an offset against advertising expense. Gross advertising expense included in SG&A follows. Fiscal 2017 in millions Gross advertising expense Fiscal 2018 $ 1,156 Fiscal 2016 $ 955 $ 995 Stock-Based Compensation We are currently authorized to issue incentive and nonqualified stock options, stock appreciation rights, restricted stock, restricted stock units, performance shares, performance units, and deferred shares to certain of our associates, officers, and directors under certain stock incentive plans. We measure and recognize compensation expense for all share-based payment awards made to associates and directors based on estimated fair values. The value of the portion of the award that is ultimately expected to vest is recognized as stock-based compensation expense over the requisite service period or as restrictions lapse. Additional information on our stock-based payment awards is included in Note 8. Income Taxes Income taxes are accounted for under the asset and liability method. We provide for federal, state, and foreign income taxes currently payable, as well as for those deferred due to timing differences between reporting income and expenses for financial statement purposes versus tax purposes. Deferred tax assets and liabilities are recognized for the future tax consequences attributable to temporary differences between the financial statement carrying amounts of existing assets and liabilities and their respective tax bases. Deferred tax assets and liabilities are measured using enacted income tax rates expected to apply to taxable income in the years in which those temporary differences are expected to be recovered or settled. The effect of a change in income tax rates is recognized as income or expense in the period that includes the enactment date. We recognize the effect of income tax positions only if those positions are more likely than not of being sustained. Recognized income tax positions are measured at the largest amount that is greater than 50% likely of being realized. Changes in recognition or measurement are reflected in the period in which the change in judgment occurs. We file a consolidated U.S. federal income tax return which includes certain eligible subsidiaries. Non-U.S. subsidiaries and certain U.S. subsidiaries, which are consolidated for financial reporting purposes, are not eligible to be included in our consolidated U.S. federal income tax return. Separate provisions for income taxes have been determined for these entities. For unremitted earnings of our non-U.S. subsidiaries, we are required to make an assertion regarding reinvestment or repatriation for tax purposes. For any earnings that we do not make a permanent reinvestment assertion, we recognize a provision for deferred income taxes. For earnings where we have made a permanent reinvestment assertion, no provision is recognized. See Note 5 for further discussion. Comprehensive Income Page A-12 Comprehensive income includes net earnings adjusted for certain gains and losses that are excluded from net earnings under GAAP, which consists primarily of foreign currency translation adjustments. Foreign Currency Translation Assets and liabilities denominated in a foreign currency are translated into U.S. dollars at the current rate of exchange on the last day of the reporting period. Revenues and expenses are translated using average exchange rates for the period and equity transactions are translated using the actual rate on the day of the transaction. Reclassifications Certain prior period amounts have been reclassified to conform to the current period's financial statement presentation. See "Recently Adopted Accounting Pronouncements below for a discussion of our adoption of new accounting standards. Reclassifications Certain prior period amounts have been reclassified to conform to the current period's financial statement presentation. See "Recently Adopted Accounting Pronouncements" below for a discussion of our adoption of new accounting standards. Recently Adopted Accounting Pronouncements ASU No. 2016-16. In October 2016, the FASB issued ASU No. 2016-16, Income Taxes (Topic 740): Intra-Entity Transfers of Assets Other Than Inventory," which requires an entity to recognize the income tax consequences of an intercompany transfer of assets other than inventory when the transfer occurs. An entity will continue to recognize the income tax consequences of an intercompany transfer of inventory when the inventory is sold to a third party. On January 29, 2018, we adopted ASU No. 2016-16 using the modified retrospective transition method with no impact on our consolidated financial statements. We expect the impact of the adoption to be immaterial to our financial position, results of operations, and cash flows on an ongoing basis. ASU No. 2014-09. In May 2014, the FASB issued a new standard related to revenue recognition. Under ASU No. 2014-09, "Revenue from Contracts with Customers (Topic 606)," revenue is recognized when a customer obtains control of promised goods or services in an amount that reflects the consideration the entity expects to receive in exchange for those goods or services. In addition, the standard requires disclosure of the nature, amount, timing, and uncertainty of revenue and cash flows arising from contracts with customers. On January 29, 2018, we adopted ASU No. 2014-09 using the modified retrospective transition method. In preparation for implementation of the standard, we finalized key accounting assessments and then implemented internal controls and updated processes to appropriately recognize and present the associated financial information. Based on these efforts, we determined that the adoption of ASU No. 2014-09 changes the presentation of (1) certain expenses and cost reimbursements associated with our PLCC program (now recognized in net sales), (ii) certain expenses related to the sale of gift cards to customers (now recognized in operating expense), and (iii) gift card breakage income (now recognized in net sales). We also have changed our recognition of gift card breakage income to be recognized proportionately as redemption occurs, rather than based on historical redemption patterns. In addition, the adoption of ASU No. 2014-09 requires that we recognize our sales return allowance on a gross basis rather than as a net liability. As such, we now recognize (i) a return asset for the right to recover the goods returned by the customer, measured at the former carrying amount of the goods, less any expected recovery costs (recorded as an increase to other current assets) and (ii) a return liability for the amount of expected returns (recorded as an increase to other accrued expenses and a decrease to receivables, net). We applied ASU No. 2014-09 only to contracts that were not completed prior to fiscal 2018. The cumulative effect of initially applying ASU No. 2014-09 was a $99 million reduction to deferred revenue, a $24 million increase to deferred income taxes (included in other long-term liabilities), and a $75 million increase to the opening balance of retained earnings as of January 29, 2018. The comparative prior period information continues to be reported under the accounting standards in effect during those periods. We expect the impact of the adoption to be immaterial to our financial position, results of operations, and cash flows on an ongoing basis. Excluding the effect of the opening balance sheet adjustment noted above, the impact of the adoption of ASU No. 2014-09 on our consolidated balance sheet as of February 3, 2019 follows. Page A-13 in millions Receivables, net Other current assets Other accrued expenses As Reported $ 1,936 890 2,611 ASU No. 2014-09 Impact S (40) 256 216 Excluding ASU No. 2014-09 Impact $ 1,976 634 2,395 The impact of the adoption of ASU No. 2014-09 on our consolidated statements of earnings for fiscal 2018 follows. in millions Net sales Cost of sales Gross profit Selling, general and administrative As Reported $ 108,203 71,043 37.160 19,513 ASU No. 2014-09 Impact $ 216 (382) 598 Excluding ASU No. 2014-09 Impact $ 107,987 71,425 36,562 18,915 598 Recently Issued Accounting Pronouncements ASU No. 2018-15. In August 2018, the FASB issued ASU No. 2018-15, "Intangibles - Goodwill and Other - Internal-Use Software (Subtopic 350-40): Customer's Accounting for Implementation Costs Incurred in a Cloud Computing Arrangement That is a Service Contract," which aligns the requirements for capitalizing implementation costs incurred in a hosting arrangement with the requirements for capitalizing implementation costs incurred to develop or obtain internal-use software. ASU No. 2018-15 is effective for us in the first quarter of fiscal 2020 and early adoption is permitted. We are evaluating the effect that ASU No. 2018-15 will have on our consolidated financial statements and related disclosures. ASU No. 2018-02. In February 2018, the FASB issued ASU No. 2018-02, Income Statement - Reporting Comprehensive Income (Topic 220): Reclassification of Certain Tax Effects from Accumulated Other Comprehensive Income," which allows for an optional reclassification from accumulated other comprehensive income to retained earnings for stranded tax effects as a result of the Tax Act. ASU No. 2018-02 is effective for us in the first quarter of fiscal 2019 and early adoption is permitted. Two transition methods are available at the beginning of the period of adoption, or retrospective to each period in which the income tax effects of the Tax Act related to items remaining in accumulated other comprehensive income are recognized. We will adopt this standard in the first quarter of 2019, applying the adjustment at the beginning of the period of adoption. We have evaluated the effect that ASU No. 2018-02 will have on our consolidated financial statements and related disclosures and noted no material impact. ASU No. 2017-12. In August 2017, the FASB issued ASU No. 2017-12, Derivatives and Hedging (Topic 815). Targeted Improvements to Accounting for Hedging Activities," which amends the hedge accounting recognition and presentation requirements. ASU No. 2017-12 eliminates the concept of recognizing periodic hedge ineffectiveness for cash flow and net investment hedges and allows an entity to apply the shortcut method to partial-term fair value hedges of interest rate risk. ASU No. 2017-12 is effective for us in the first quarter of fiscal 2019. Early adoption is permitted in any interim period after issuance of this update. We have evaluated the effect that ASU No. 2017-12 will have on our consolidated financial statements and related disclosures and noted no material impact. ASU No. 2017-04. In January 2017, the FASB issued ASU No. 2017-04, "Intangibles-Goodwill and Other (Topic 350): Simplifying the Test for Goodwill Impairment," which simplifies how an entity is required to test goodwill for impairment. The amendments in ASU No. 2017- 04 require goodwill impairment to be measured using the difference between the carrying amount and the fair value of the reporting unit and require the loss recognized to not exceed the total amount of goodwill allocated to that reporting unit. ASU No. 2017-04 should be applied on a prospective basis and is effective for our annual goodwill impairment tests beginning in the first quarter of fiscal 2020. Early adoption is permitted. We have evaluated the effect that ASU No. 2017-04 will have on our consolidated financial statements and related disclosures and noted no material impact. Page A-14 ASU No. 2016-02. In February 2016, the FASB issued ASU No. 2016-02, Leases (Topic 842)," which establishes a right-of-use model and requires an entity that is a lessee to recognize the right-of-use assets and liabilities arising from leases on its balance sheet. ASU No. 2016- 02 also requires disclosures about the amount, timing, and uncertainty of cash flows arising from leases. Leases will be classified as finance or operating, with classification affecting the pattern and classification of expense recognition in the income statement. This new standard is effective for us on February 4, 2019 (the "effective date"). ASU No. 2016-02 was subsequently amended by ASU No. 2018-01, Land Easement Practical Expedient for Transition to Topic 842", ASU No. 2018-10, "Codification Improvements to Topic 842"; and ASU No. 2018-11, Targeted Improvements. ASU 2016-02 and relevant updates require a modified retrospective transition, with the cumulative effect of transition, including initial recognition of lease assets and liabilities for existing operating leases as of (1) the effective date or (ii) the beginning of the earliest comparative period presented. These updates also provide a number of practical expedients for transition and implementation that will be elected. We will adopt this standard using the modified retrospective method with a cumulative-effect adjustment to the opening balance of retained earnings as of the effective date. We plan to elect the package of practical expedients in transition, which permits us to not reassess our prior conclusions pertaining to lease identification, lease classification, and initial direct costs on leases that commenced prior to our adoption of the new standard. We do not expect to elect the use-of-hindsight or land easements transition practical expedients. Additionally, we will elect ongoing practical expedients including the option to not recognize right-of-use assets and lease liabilities related to leases with an original term of twelve months or less. We believe that ASU 2016-02 will have a material impact on our consolidated balance sheet as a result of the requirement to recognize right-of-use assets and lease liabilities for our operating leases upon adoption. We estimate total assets and liabilities will increase approximately $6 billion upon adoption. This estimate may change as the implementation is finalized as a result of changes to our lease portfolio prior to adoption. We do not believe that there will be a material impact to our results of operations, stockholders' equity, or cash flows upon adoption of ASU No. 2016-02. We reviewed and selected a new lease accounting system and are currently accumulating and processing lease data into the system. We are continuing to evaluate our internal control framework, including implementing changes to our processes, controls, and systems in connection therewith, to determine any necessary changes upon adoption of ASU 2016-02. Recent accounting pronouncements pending adoption not discussed above are either not applicable or are not expected to have a material impact on us. 2. NET SALES AND SEGMENT REPORTING We currently conduct our retail operations in the U.S., Canada, and Mexico, each of which represents one of our three operating segments. Our operating segments reflect the way in which internally-reported financial information is used to make decisions and allocate resources. For disclosure purposes, we aggregate these three operating segments into one reportable segment due to their similar operating and financial characteristics and how the business is managed The assets of each of our operating segments primarily consist of net property and equipment and merchandise inventories. Long-lived assets, classified by geography, follow. January 28, 2018 January 29, 2017 in millions Long-lived assets - in the U.S. Long-lived assets - outside the U.S. Total long-lived assets February 3, 2019 $ 19,930 2,445 $ 22,375 $19,526 2,549 $ 22,075 $ 19,519 2,395 $ 21,914 No sales to an individual customer accounted for more than 10% of revenue during any of the last three fiscal years. Net sales, classified by geography, follow Fiscal 2018 Fiscal 2017 in millions Net sales - in the U.S. Net sales - outside the U.S. Net sales $ 99,386 8,817 $ 108,203 $ 92,413 8,491 $ 100,904 Fiscal 2016 $ 86,615 7,980 $ 94,595 Fiscal 2015 Fiscal 2014 THE HOME DEPOT, INC. SELECTED FINANCIAL DATA amounts in millions, except per share data or where noted Fiscal 2018 Fiscal 2017 Fiscal 2016 STATEMENT OF EARNINGS DATA Net sales $ 108,203 $ 100,904 $ 94,595 Net sales increase (%) 7.2 6.7 6.9 Earnings before provision for income taxes () 14,556 13,698 12.491 Net earnings ($) 11,121 8,630 7,957 Net earnings increase (%) 28.9 13.5 Diluted earnings per share ($) 9.73 7.29 6.45 Diluted earnings per share increase (%) 33.5 13.0 18.1 Diluted weighted average number of common shares 1,143 1,184 1,234 Gross profit - % of sales 34.3 34.0 34.2 Total operating expenses - % of sales 20.0 19.5 20.0 Net earnings - % of sales 10.3 8.6 8.4 8.5 $ 88,519 6.4 11,021 7,009 10.5 5.46 15.9 1,283 34.2 20.9 7.9 $ 83,176 5.5 9,976 6,345 17.8 4.71 25.3 1,346 34.1 21.5 7.6 $ $ BALANCE SHEET DATA AND FINANCIAL RATIOS Total assets Working capital ($) Merchandise inventories ($) Net property and equipment ($)(1) Long-term debt, excluding current installments (S) Stockholders' (deficit) equity (S) Total debt-to-equity (%) Inventory turnover $ 44,003 1.813 13,925 22,375 26,807 (1.878) (1,550.0) 5.1x 44,529 2.739 12,748 22,075 24,267 1,454 1,858.9 5.Ix $ 42,966 3,591 12,549 21,914 22,349 4,333 544.7 4.9x 41,973 3,960 11,809 22,191 20,789 6,316 335.9 4.9x $ 39,449 3,589 11,079 22.720 16,786 9,322 183.6 4.7x STATEMENT OF CASH FLOWS DATA Depreciation and amortization Capital expenditures (8) $ $ $ FA S 2,152 2,442 2,062 1,897 1.973 1,621 1,863 1,503 1,786 1,442 44.8 4.12 2,287 238 OTHER KEY METRICS Return on invested capital (%) Cash dividends per share (8) Number of stores Square footage at fiscal year-end Comparable sales increase (%)(2) Sales per square foot ($)(3) Customer transactions(3) Average ticket (S)(3) Number of associates at fiscal year-end (in thousands) 5.2 34.2 3.56 2,284 237 6.8 417.02 1,579 63.06 413 31.4 2.76 2,278 237 5.6 390.78 1,544 60.35 406 28.1 2.36 2.274 237 5.6 370.55 1,501 58.77 385 25.0 1.88 2,269 236 5.3 352.22 1,442 57.87 371 446.86 1,621 65.74 413


