

Answered step by step
Verified Expert Solution
Question
1 Approved Answer
Complete chart above for years 2015-2018. Data Table: Consider the financial statement data and stock price data for Mydeco Corp. Suppose Mydeco's costs and expenses
 Complete chart above for years 2015-2018.
Data Table:
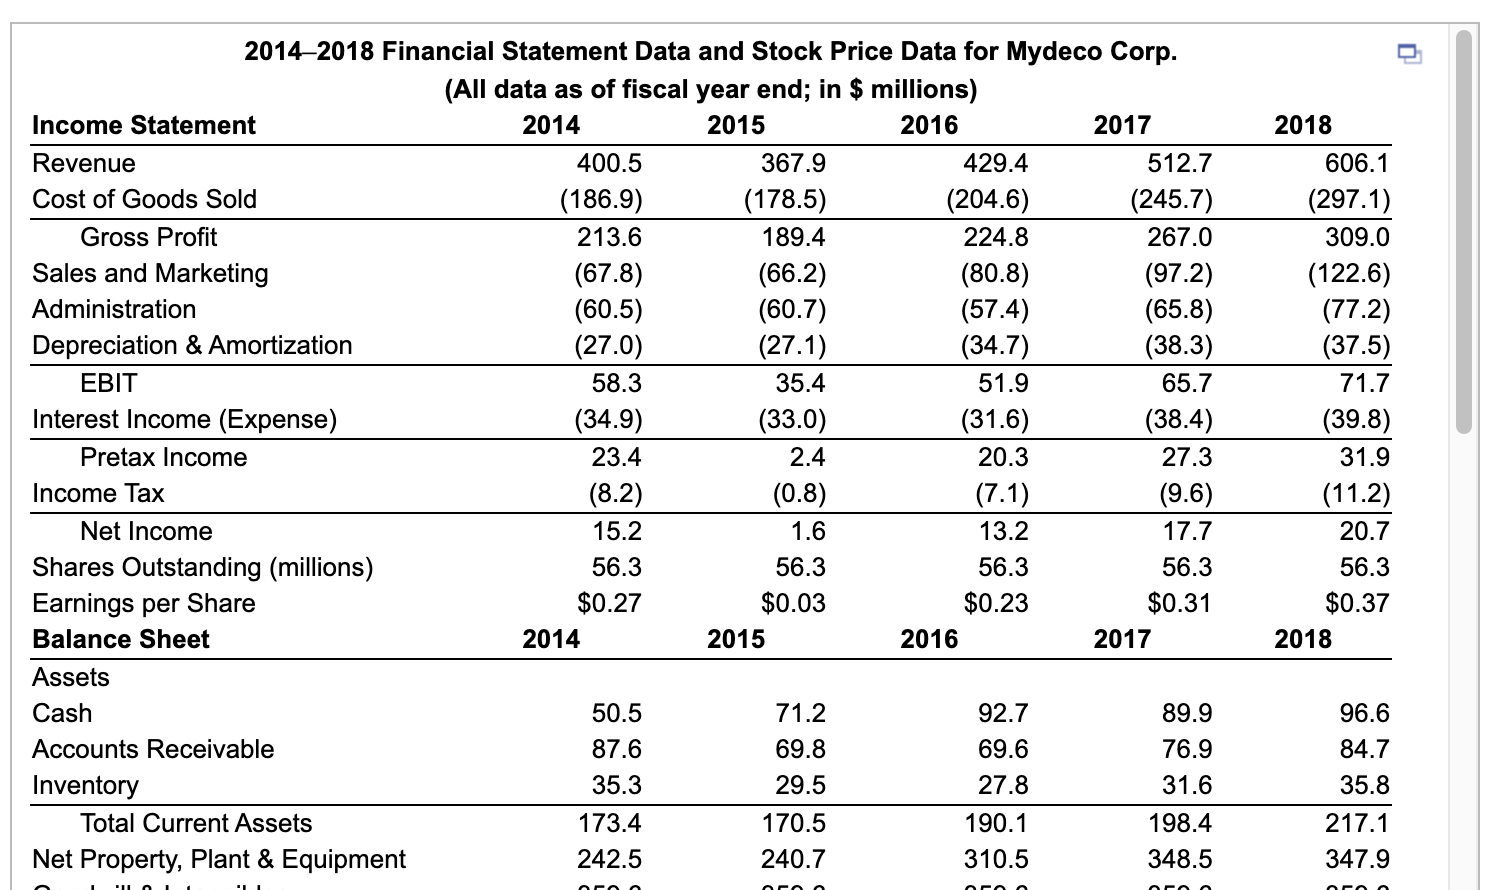
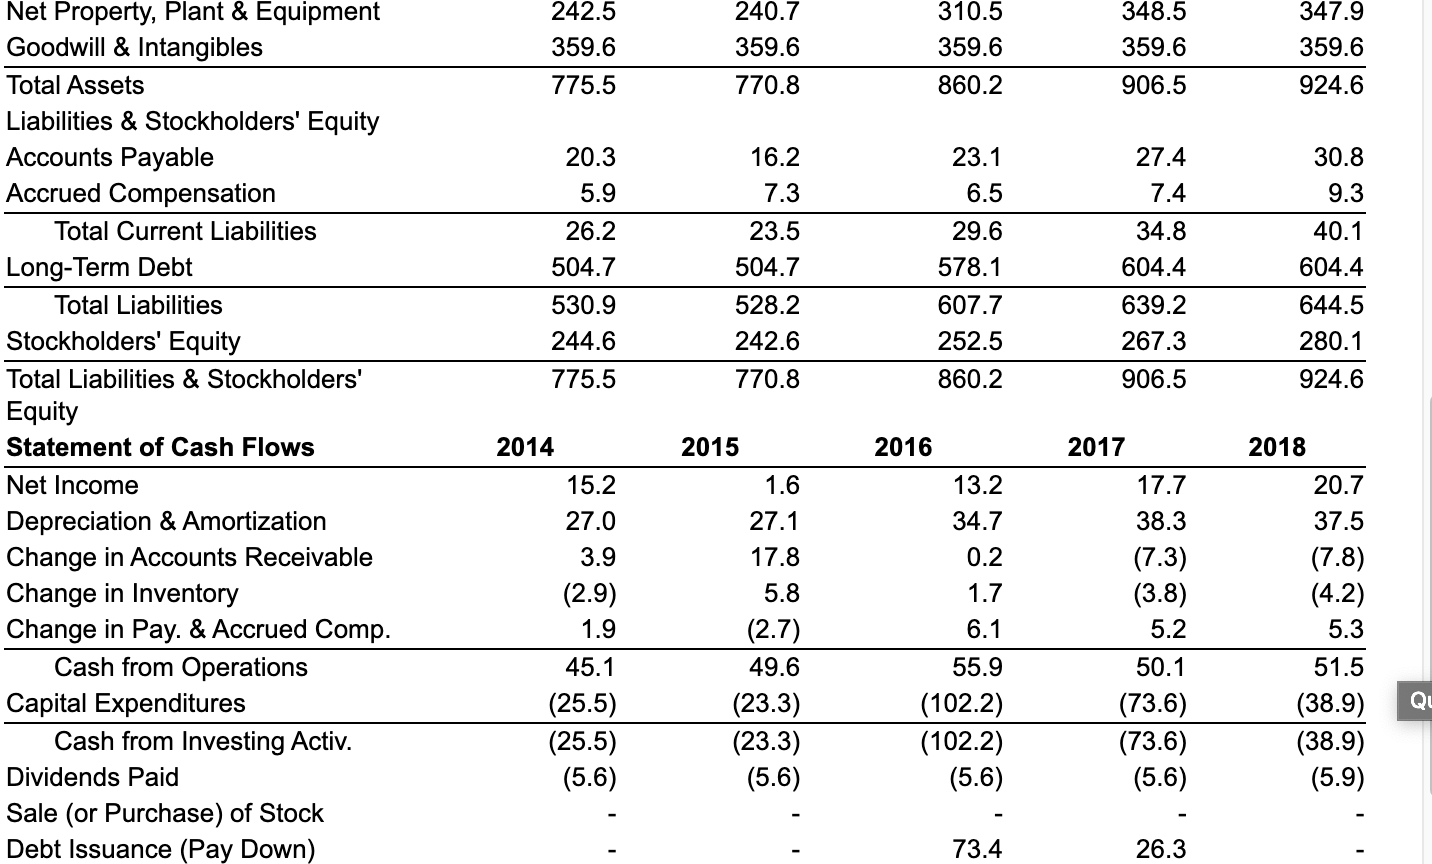

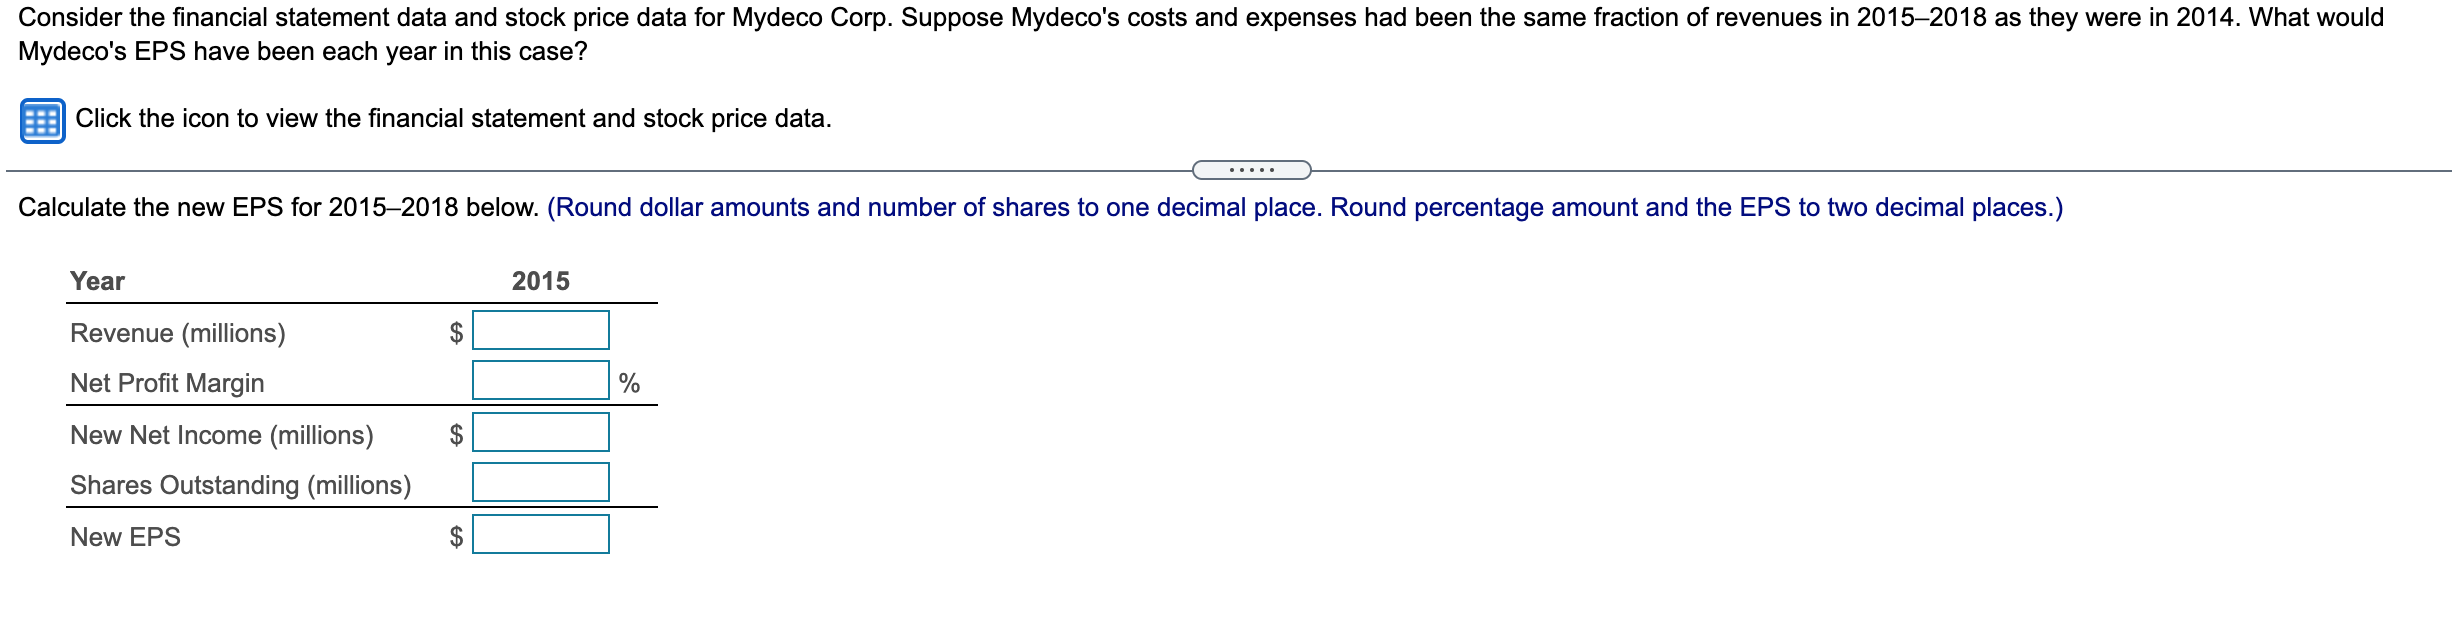
Consider the financial statement data and stock price data for Mydeco Corp. Suppose Mydeco's costs and expenses had been the same fraction of revenues in 20152018 as they were in 2014. What would Mydeco's EPS have been each year in this case? Click the icon to view the financial statement and stock price data. Calculate the new EPS for 20152018 below. (Round dollar amounts and number of shares to one decimal place. Round percentage amount and the EPS to two decimal places.) Year 2015 $ % Revenue (millions) Net Profit Margin New Net Income (millions) Shares Outstanding (millions) $ New EPS 20142018 Financial Statement Data and Stock Price Data for Mydeco Corp. (All data as of fiscal year end; in $ millions) Income Statement 2014 2015 2016 2017 Revenue 400.5 367.9 429.4 512.7 Cost of Goods Sold (186.9) (178.5) (204.6) (245.7) Gross Profit 213.6 189.4 224.8 267.0 Sales and Marketing (67.8) (66.2) (80.8) (97.2) Administration (60.5) (60.7) (57.4) (65.8) Depreciation & Amortization (27.0) (27.1) (34.7) (38.3) EBIT 58.3 35.4 51.9 65.7 Interest Income (Expense) (34.9) (33.0) (31.6) (38.4) Pretax Income 23.4 2.4 20.3 27.3 Income Tax (8.2) (0.8) (7.1) (9.6) Net Income 15.2 1.6 13.2 17.7 Shares Outstanding (millions) 56.3 56.3 56.3 56.3 Earnings per Share $0.27 $0.03 $0.23 $0.31 Balance Sheet 2014 2015 2016 2017 Assets Cash 50.5 71.2 92.7 89.9 Accounts Receivable 87.6 69.8 69.6 76.9 Inventory 35.3 29.5 27.8 31.6 Total Current Assets 173.4 170.5 190.1 198.4 Net Property, Plant & Equipment 242.5 240.7 310.5 348.5 2018 606.1 (297.1) 309.0 (122.6) (77.2) (37.5) 71.7 (39.8) 31.9 (11.2) 20.7 56.3 $0.37 2018 96.6 84.7 35.8 217.1 347.9 242.5 359.6 240.7 359.6 770.8 310.5 359.6 860.2 348.5 359.6 906.5 347.9 359.6 775.5 924.6 30.8 23.1 6.5 9.3 29.6 20.3 5.9 26.2 504.7 530.9 244.6 16.2 7.3 23.5 504.7 528.2 242.6 27.4 7.4 34.8 604.4 639.2 267.3 906.5 40.1 604.4 578.1 607.7 252.5 644.5 280.1 924.6 775.5 770.8 860.2 Net Property, Plant & Equipment Goodwill & Intangibles Total Assets Liabilities & Stockholders' Equity Accounts Payable Accrued Compensation Total Current Liabilities Long-Term Debt Total Liabilities Stockholders' Equity Total Liabilities & Stockholders' Equity Statement of Cash Flows Net Income Depreciation & Amortization Change in Accounts Receivable Change in Inventory Change in Pay. & Accrued Comp. Cash from Operations Capital Expenditures Cash from Investing Activ. Dividends Paid Sale (or Purchase) of Stock Debt Issuance (Pay Down) 2014 15.2 27.0 3.9 (2.9) 1.9 45.1 (25.5) (25.5) (5.6) 2015 1.6 27.1 17.8 5.8 (2.7) 49.6 (23.3) (23.3) (5.6) 2016 13.2 34.7 0.2 1.7 6.1 55.9 (102.2) (102.2) (5.6) 2017 17.7 38.3 (7.3) (3.8) 5.2 50.1 (73.6) (73.6) (5.6) 2018 20.7 37.5 (7.8) (4.2) 5.3 51.5 (38.9) (38.9) (5.9) QL 73.4 26.3 Cash from Financing Activ. Change in Cash Mydeco Stock Price (5.6) 14.0 $7.21 (5.6) 20.7 $3.18 67.8 21.5 $5.84 20.7 (2.8) $8.74 (5.9) 6.7 $10.12
Step by Step Solution
There are 3 Steps involved in it
Step: 1

Get Instant Access to Expert-Tailored Solutions
See step-by-step solutions with expert insights and AI powered tools for academic success
Step: 2

Step: 3
Ace Your Homework with AI
Get the answers you need in no time with our AI-driven, step-by-step assistance
Get Started
Office Of Anticorruption And Integrity Annual Report 2023
Authors: Asian Development Bank
1st Edition
9292544381,929254439X