Question
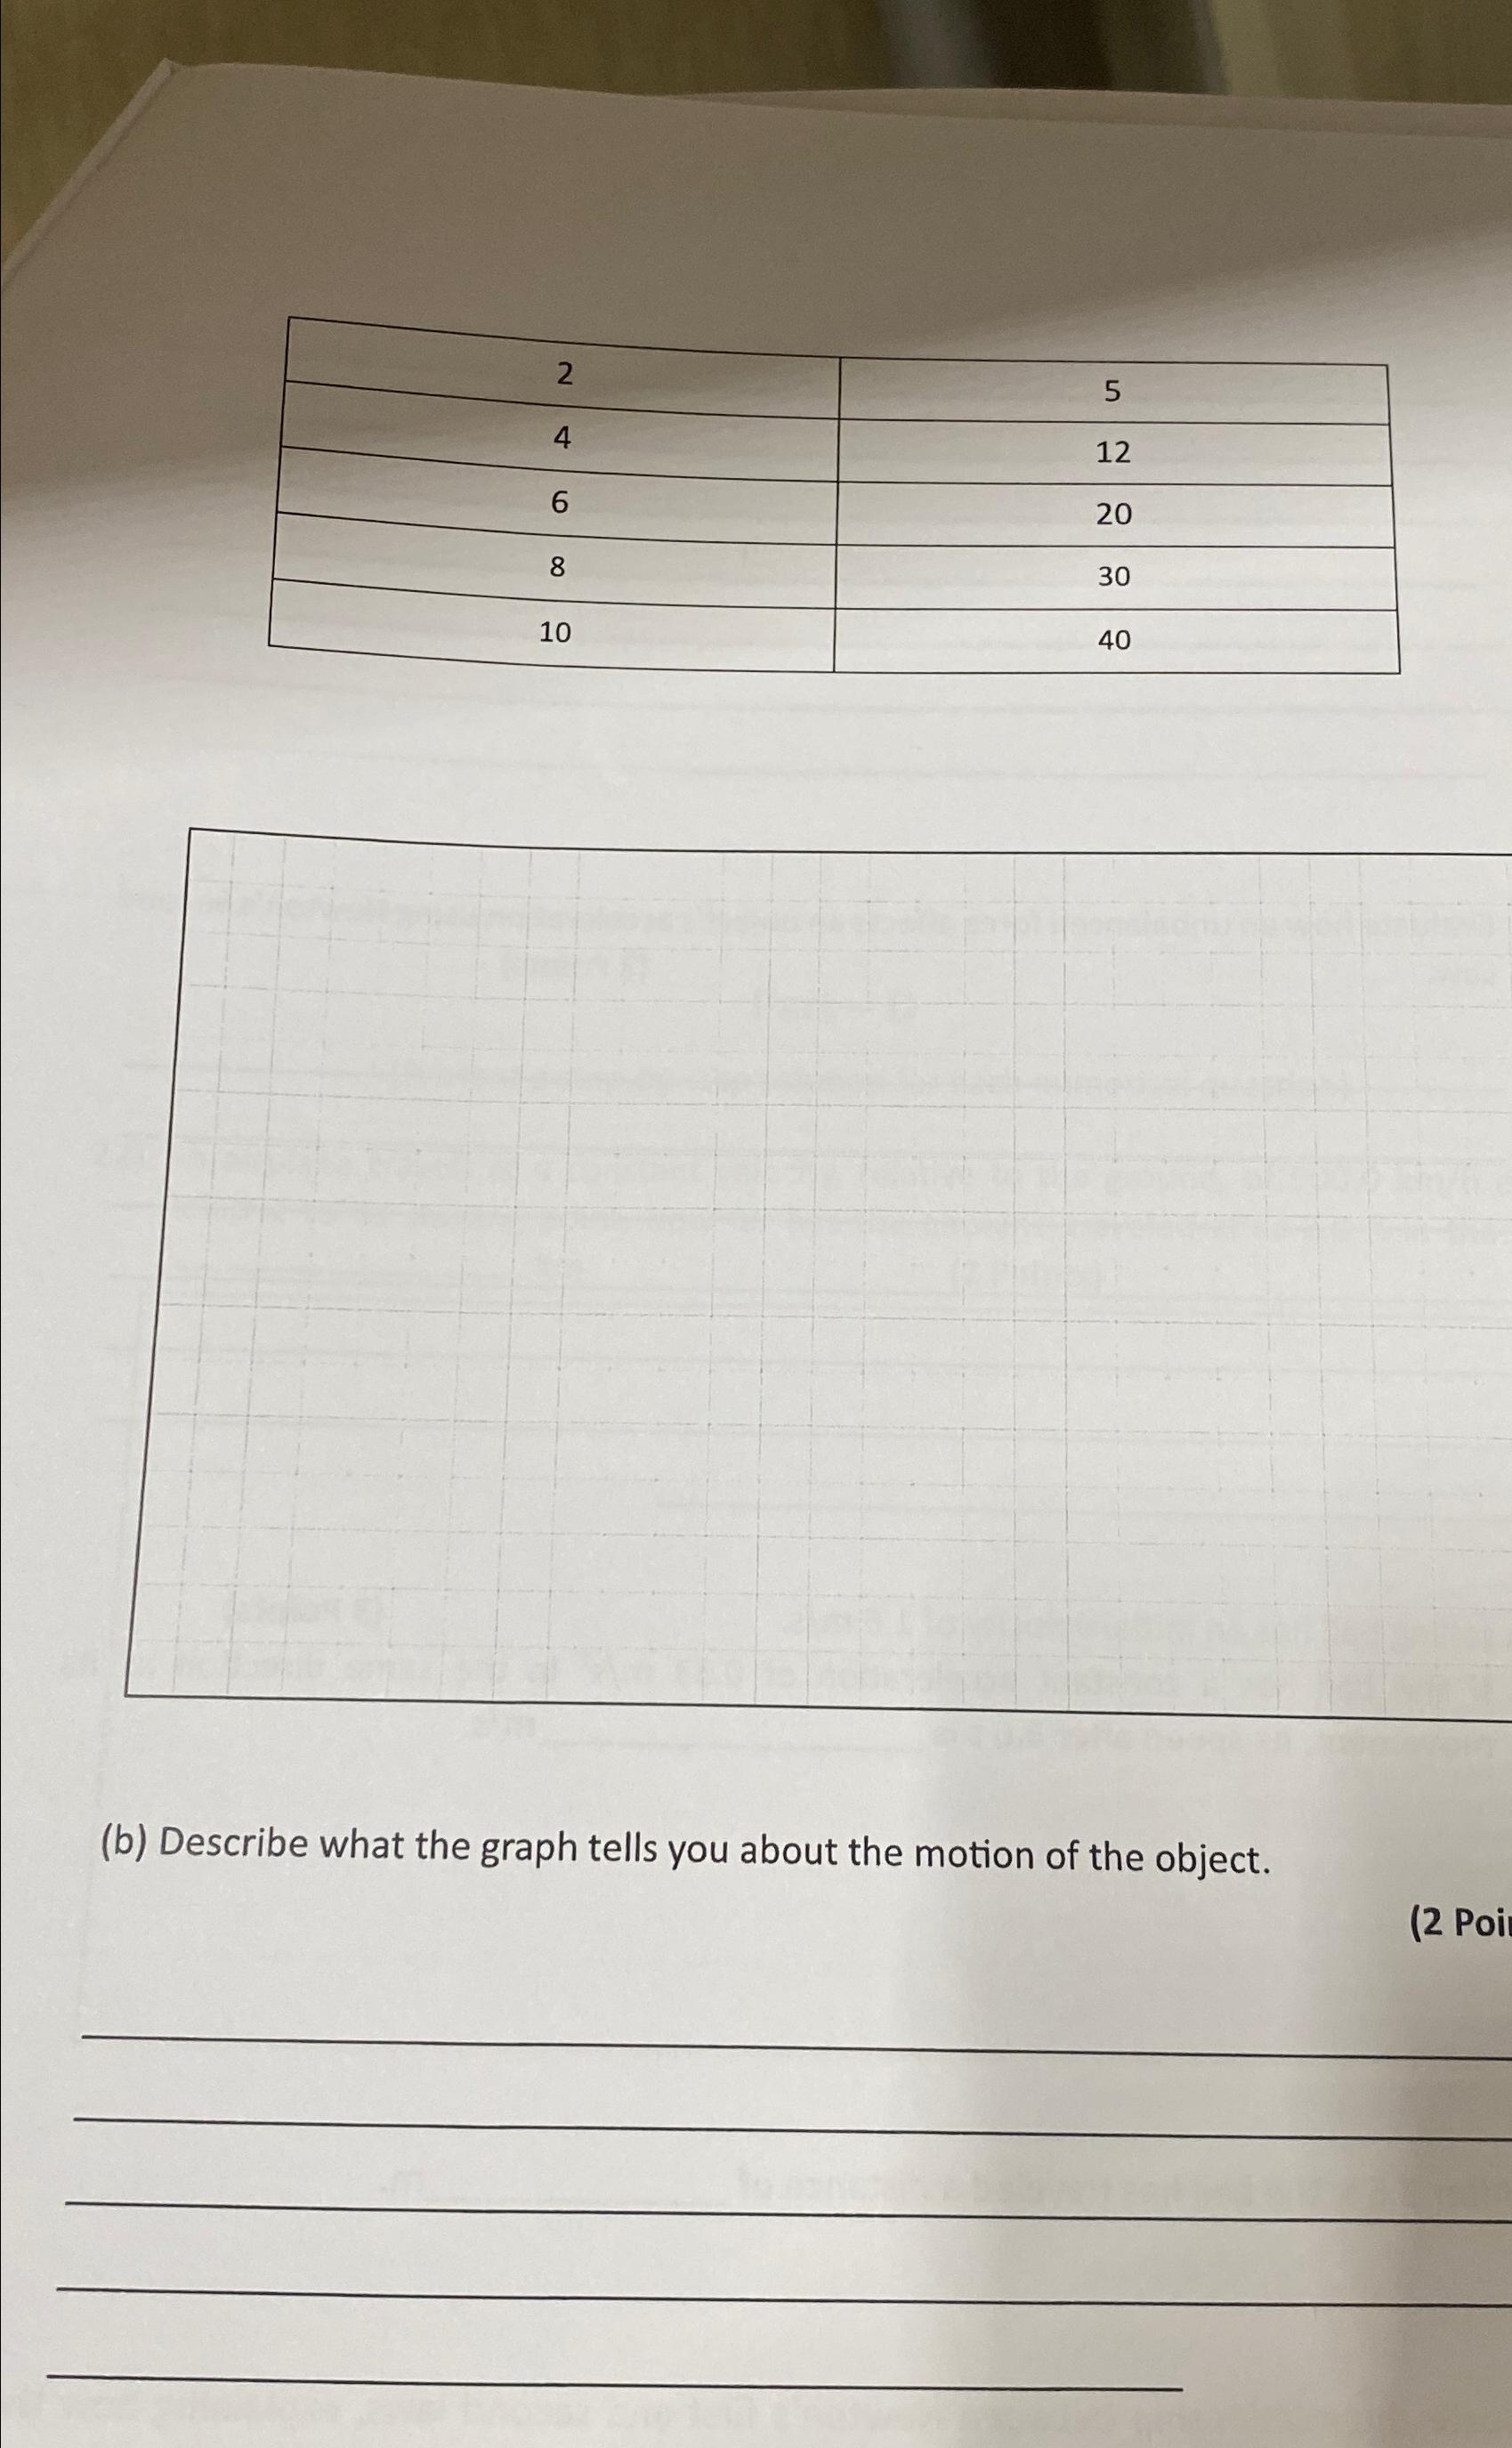
Complete each question by providing the required solution ) ( a ) ?Draw a distance - time graph using the data in the table 1
Complete each question by providing the required solution
a ?Draw a distancetime graph using the data in the table ?below
i ?Scaling the axis point
ii ?Labelling the axis ?points
iii ?Title of the graph ?point
iv ?Plotting the points ?point
v ?Drawing the best fit line ?point

2 5 4 12 6 20 8 30 10 40 (b) Describe what the graph tells you about the motion of the object. (2 Poi
Step by Step Solution
There are 3 Steps involved in it
Step: 1

Get Instant Access to Expert-Tailored Solutions
See step-by-step solutions with expert insights and AI powered tools for academic success
Step: 2

Step: 3

Ace Your Homework with AI
Get the answers you need in no time with our AI-driven, step-by-step assistance
Get StartedRecommended Textbook for
Cost Management Accounting And Control
Authors: Don R. Hansen, Maryanne M. Mowen, Liming Guan
6th Edition
324559674, 978-0324559675
Students also viewed these Physics questions
Question
Answered: 1 week ago
Question
Answered: 1 week ago
Question
Answered: 1 week ago
Question
Answered: 1 week ago
Question
Answered: 1 week ago
Question
Answered: 1 week ago
Question
Answered: 1 week ago
Question
Answered: 1 week ago
Question
Answered: 1 week ago
Question
Answered: 1 week ago
Question
Answered: 1 week ago
Question
Answered: 1 week ago
Question
Answered: 1 week ago
Question
Answered: 1 week ago
Question
Answered: 1 week ago
Question
Answered: 1 week ago
Question
Answered: 1 week ago
Question
Answered: 1 week ago
Question
Answered: 1 week ago
Question
Answered: 1 week ago
Question
Answered: 1 week ago
Question
Answered: 1 week ago
View Answer in SolutionInn App


