

Answered step by step
Verified Expert Solution
Question
1 Approved Answer
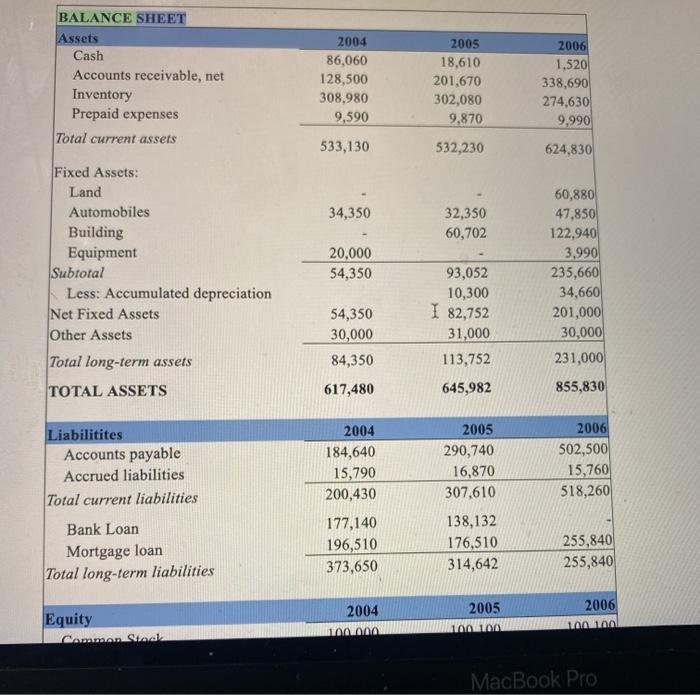
complete invome statment BALANCE SHEET Assets Cash Accounts receivable, net Inventory Prepaid expenses Total current assets 2004 86,060 128,500 308,980 9,590 2005 18,610 201,670 302,080
complete invome statment
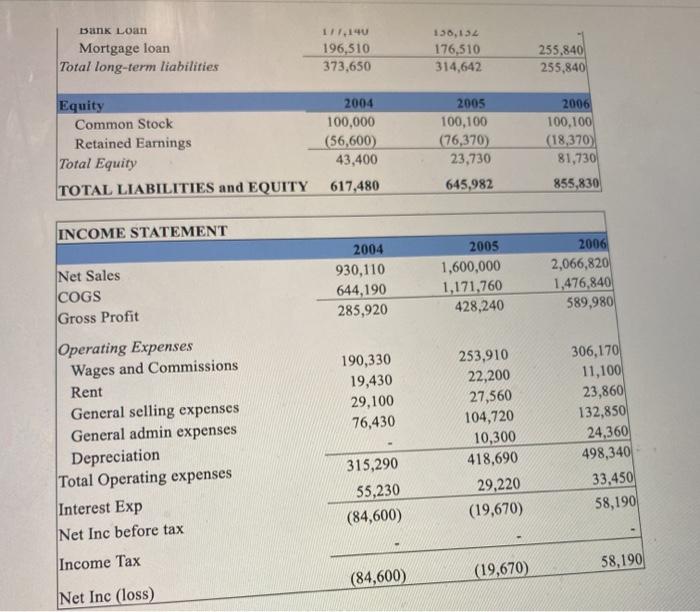
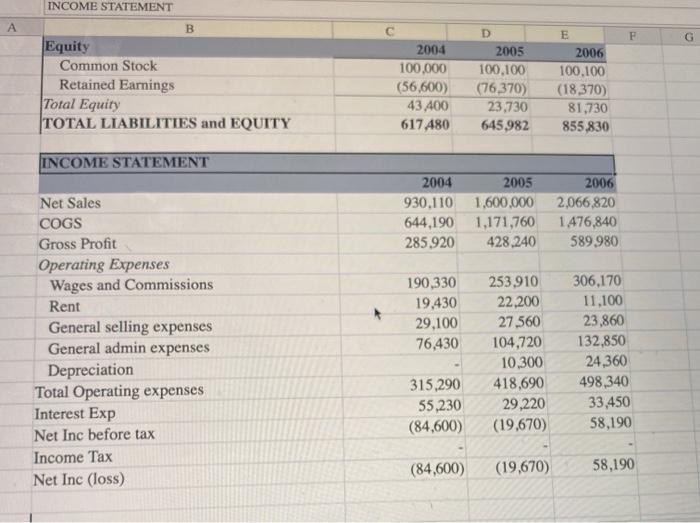
BALANCE SHEET Assets Cash Accounts receivable, net Inventory Prepaid expenses Total current assets 2004 86,060 128,500 308,980 9,590 2005 18,610 201,670 302,080 9,870 2006 1.520 338,690 274,630 9,990 533,130 532,230 624,830 34,350 32,350 60,702 Fixed Assets: Land Automobiles Building Equipment Subtotal Less: Accumulated depreciation Net Fixed Assets Other Assets Total long-term assets 20,000 54,350 60,880 47,850 122,940 3,990 235,660 34,660 201,000 30,000 231,000 93,052 10,300 I 82,752 31,000 113,752 54,350 30,000 84,350 TOTAL ASSETS 617,480 645,982 855,830 Liabilitites Accounts payable Accrued liabilities Total current liabilities 2004 184,640 15,790 200,430 2005 290,740 16,870 307,610 2006 502,500 15,760 518,260 Bank Loan Mortgage loan Total long-term liabilities 177,140 196,510 373,650 138,132 176,510 314,642 255,840 255,840 Equity 2004 100.000 2005 100100 2006 100 100 Cowan Store MacBook Pro bunk Loan Mortgage loan Total long-term liabilities 111.140 196,510 373,650 136,132 176,510 314,642 255,840 255,840 Equity Common Stock Retained Earnings Total Equity TOTAL LIABILITIES and EQUITY 2004 100,000 (56,600) 43,400 617,480 2005 100,100 (76,370) 23,730 645,982 2006 100,100 (18,370) 81,730 855,830 INCOME STATEMENT Net Sales COGS Gross Profit 2004 930,110 644,190 285,920 2005 1,600,000 1,171,760 428,240 2006 2,066,820 1,476,840 589,980 190,330 19,430 29,100 76,430 Operating Expenses Wages and Commissions Rent General selling expenses General admin expenses Depreciation Total Operating expenses Interest Exp Net Inc before tax 253,910 22,200 27,560 104,720 10,300 418,690 29,220 (19,670) 306,170 11,100 23,860 132,850 24,360 498,340 33,450 58,190 315,290 55,230 (84,600) Income Tax 58,190 (84,600) (19,670 Net Inc (loss) INCOME STATEMENT A B E F G Equity Common Stock Retained Earnings Total Equity TOTAL LIABILITIES and EQUITY 2004 100.000 (56,600) 43.400 617.480 D 2005 100,100 (76,370) 23,730 645,982 2006 100,100 (18,370) 81,730 855,830 INCOME STATEMENT 2004 2005 930,110 1,600,000 644,190 1,171,760 285.920 428.240 2006 2,066,820 1.476,840 589980 Net Sales COGS Gross Profit Operating Expenses Wages and Commissions Rent General selling expenses General admin expenses Depreciation Total Operating expenses Interest Exp Net Inc before tax Income Tax Net Inc (loss) 190,330 19.430 29,100 76,430 253.910 22,200 27560 104,720 10,300 418,690 29,220 (19,670) 306,170 11.100 23,860 132,850 24,360 498,340 33,450 58.190 315,290 55,230 (84.600) (84,600) (19,670) 58,190 BALANCE SHEET Assets Cash Accounts receivable, net Inventory Prepaid expenses Total current assets 2004 86,060 128,500 308,980 9,590 2005 18,610 201,670 302,080 9,870 2006 1.520 338,690 274,630 9,990 533,130 532,230 624,830 34,350 32,350 60,702 Fixed Assets: Land Automobiles Building Equipment Subtotal Less: Accumulated depreciation Net Fixed Assets Other Assets Total long-term assets 20,000 54,350 60,880 47,850 122,940 3,990 235,660 34,660 201,000 30,000 231,000 93,052 10,300 I 82,752 31,000 113,752 54,350 30,000 84,350 TOTAL ASSETS 617,480 645,982 855,830 Liabilitites Accounts payable Accrued liabilities Total current liabilities 2004 184,640 15,790 200,430 2005 290,740 16,870 307,610 2006 502,500 15,760 518,260 Bank Loan Mortgage loan Total long-term liabilities 177,140 196,510 373,650 138,132 176,510 314,642 255,840 255,840 Equity 2004 100.000 2005 100100 2006 100 100 Cowan Store MacBook Pro bunk Loan Mortgage loan Total long-term liabilities 111.140 196,510 373,650 136,132 176,510 314,642 255,840 255,840 Equity Common Stock Retained Earnings Total Equity TOTAL LIABILITIES and EQUITY 2004 100,000 (56,600) 43,400 617,480 2005 100,100 (76,370) 23,730 645,982 2006 100,100 (18,370) 81,730 855,830 INCOME STATEMENT Net Sales COGS Gross Profit 2004 930,110 644,190 285,920 2005 1,600,000 1,171,760 428,240 2006 2,066,820 1,476,840 589,980 190,330 19,430 29,100 76,430 Operating Expenses Wages and Commissions Rent General selling expenses General admin expenses Depreciation Total Operating expenses Interest Exp Net Inc before tax 253,910 22,200 27,560 104,720 10,300 418,690 29,220 (19,670) 306,170 11,100 23,860 132,850 24,360 498,340 33,450 58,190 315,290 55,230 (84,600) Income Tax 58,190 (84,600) (19,670 Net Inc (loss) INCOME STATEMENT A B E F G Equity Common Stock Retained Earnings Total Equity TOTAL LIABILITIES and EQUITY 2004 100.000 (56,600) 43.400 617.480 D 2005 100,100 (76,370) 23,730 645,982 2006 100,100 (18,370) 81,730 855,830 INCOME STATEMENT 2004 2005 930,110 1,600,000 644,190 1,171,760 285.920 428.240 2006 2,066,820 1.476,840 589980 Net Sales COGS Gross Profit Operating Expenses Wages and Commissions Rent General selling expenses General admin expenses Depreciation Total Operating expenses Interest Exp Net Inc before tax Income Tax Net Inc (loss) 190,330 19.430 29,100 76,430 253.910 22,200 27560 104,720 10,300 418,690 29,220 (19,670) 306,170 11.100 23,860 132,850 24,360 498,340 33,450 58.190 315,290 55,230 (84.600) (84,600) (19,670) 58,190 Step by Step Solution
There are 3 Steps involved in it
Step: 1

Get Instant Access to Expert-Tailored Solutions
See step-by-step solutions with expert insights and AI powered tools for academic success
Step: 2

Step: 3
Ace Your Homework with AI
Get the answers you need in no time with our AI-driven, step-by-step assistance
Get Started
Public Finance
Authors: Harvey Rosen
6th International Edition
0071121234, 978-0071121231