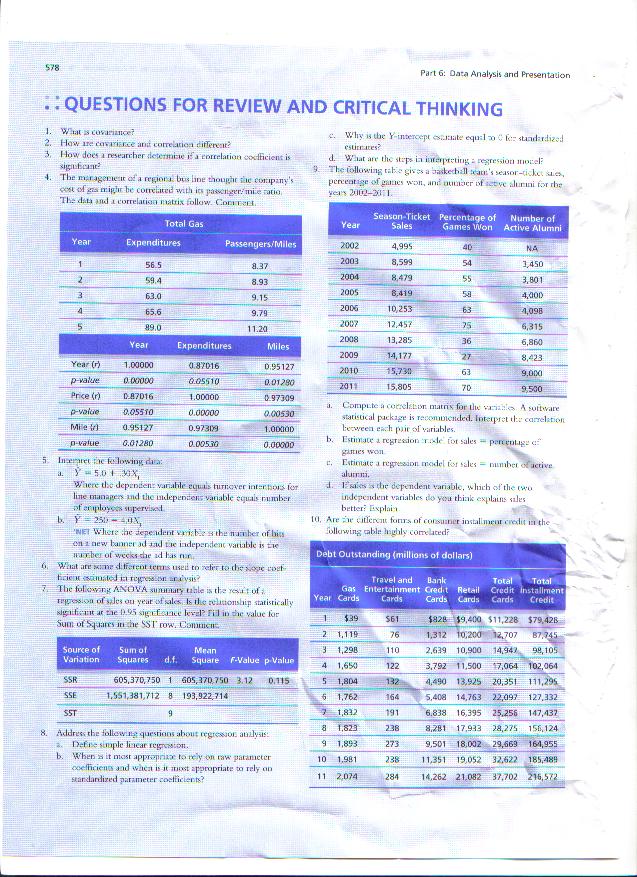
Complete question 4 in your textbook on page 578 (Chapter 23). Create your table in Word as shown on page 578 for this question. Provide
Your response should be at least 75 words in length. You are required to use at least your textbook as source material for your response. All sources used, including the textbook, must be referenced; paraphrased and quoted material must have accompanying citations.

578 ::QUESTIONS FOR REVIEW AND CRITICAL THINKING 1. What is covariance? 2. How are covariance and correlation different? 3. How does a researcher determine if a correlation coefficient is significant 4. The management of a regional bus line thought the company's cost of gs might be correlated with its passenger: mise ratio The data and a correlation matrix follow. CorEEZEL. Total Gas Year 1 2 3 4 5 Year (r) p-value Price (r) p-value Mile p-value Expenditures 56.5 59.4 Source of Variation 63.0 65.6 89.0 Year 1.00000 0.00000 0.87016 0.05510 0.95127 0.01280 Passengers/Miles 8.37 8.93 9.15 9.79 11.20 Expenditures 0.87016 0.05510 1.00000 0.00000 0.97309 0.00530 Miles 0.95127 0.01280 0.97309 0.00530 1.00000 0.00000 5. Interpret the flowing dara: a. 5.03X, Where the dependen: variable equals turnover interiors for line managers and the independens variable equals number of employees supervised b. Y 250-40X NET Where the dependent variables the number of his en new banner ad sad the independent variable is the warber of weeks dhe ad has run 6. What are some different tenns used to refer to the scope cont ficient esmated in regression analysis? 7. The following ANOVA summary table is the rest of regression of sales ou year of sales. Is the relationship statistically significant at the 0.95 sigefcance level Fil in the value for Sum of Squares in the SST row. Commen Sum of Mean Squares d.f. Square F-Value p-Value SSR SSE SST 8. Address the following questions about regression analysis: a Define simple linear regression. b. When as it most approprize to rely on raw parameter coefficients and when is it most appropriate to rely on standardized parameter coefficients? 605,370,750 1 605,370.750 3.12 0.115 1,551,381,712 8 193,922,714 9 e. Why is the Y-intercept estate equal ofer standardized estimates? 9. d. What are the steps in interpreting regression mocel? The following table gives a basketball team's seasor-ticket sales, percentage of games won, and aumber of active alumini for the years 2002-2011 Year a. 2002 2003 2004 2005 2006 2007 2008 2009 2010 2011 Part 6: Data Analysis and Presentation. Year Cards Season-Ticket Sales 4,995 8,599 8,479 8,419 10,253 12,457 13,285 14,177 15,730 15,805 4 5 1 $39 2 1,119 3 1,298 1,650 1,804 6 1,762 7 1,832 8 1,823 9 1,893 10 1,981 2,074 11 Percentage of Games Won $61 76 110 122 132 164 191 238 273 238 284 40 54 55 50 63 25 36 27 63 Compute a correlation matris for the variables. A software statistical package is recommended. Interpret the carrelation between each pair of variables. b. Estimate a regression rode for sales games won percentage c e. Estimate a regression model for sales alumni. number of active d. sales is the dependent variable, which of the two independent variables do you think explains ales better? Explain 70 Number of Active Alumni 10, Are the citlerent forms of consumer installment credit in the following cable highly correlated? Debt Outstanding (millions of dollars) Travel and Bank Total Total Gas Entertainment Credit Retail Credit installment Cards Cards Cards Credit Cards $828 $9,400 $11,228 $79,428 87,745 1,312 10,200 12,707 2,639 10,900 14,947 98,105. NA 1,450 3,801 4,000 4,098 6,315 6,860 8,423 9,000 9,500 3,792 11,500 17,064 102,064 4,490 13,925 20,351 111,295 5,408 14,763 22,097 127,332 6.838 16,395 25.256 147,437 8,281 17,933 28,275 156,124 9,501 18,002 29,669 164,955 11,351 19,052 32,622 185,489 14,262 21.082 37,702 216,572
Step by Step Solution
3.52 Rating (169 Votes )
There are 3 Steps involved in it
Step: 1
We can see that both Expenditure and PassengersMiles ratio i...
See step-by-step solutions with expert insights and AI powered tools for academic success
Step: 2

Step: 3

Ace Your Homework with AI
Get the answers you need in no time with our AI-driven, step-by-step assistance
Get Started


