

Question
Complete the balance sheet and budgeted income statement using the below information as well as the related questions :1. What were your goals for the
Complete the balance sheet and budgeted income statement using the below information as well as the related questions :1. What were your goals for the master budget you created for July, August, and September? 2. What process did you use to create each of the four budgets? Did the budgeting process differ between different departments? Explain.

Information to be used:
The following data (in thousands) pertain to 2017: Direct materials and supplies purchased on credit: $800 Direct materials used: $710 Indirect materials issued to various production departments: $100 Direct manufacturing labor: $1,300 Indirect manufacturing labor incurred by various production departments: $900 Depreciation on building and manufacturing equipment: $400 Miscellaneous manufacturing overhead incurred by various production departments: $550 o (Ordinarily, this would be detailed as repairs, photocopying, utilities, etc.) Manufacturing overhead allocated at 160% of direct manufacturing labor costs: ? Cost of goods manufactured: $4,120 Revenues: $8,000 Cost of goods sold (before adjustment for under- or overallocated manufacturing overhead): $4,020 Inventories, December 31, 2016 (not 2017): o Materials control: $100 o Work-in-process control: $60 o Finished goods control: $500 Submission Requirements for Final Project I: As the accountant, the company has asked you to perform the following tasks: 1. Prepare an overview diagram of the job-costing system at the SRS Educational Press. 2. Prepare journal entries to summarize the 2017 transactions. As your final entry, dispose of the year-end under- or overallocated manufacturing overhead as a write-off to cost of goods sold. Number your entries. Explanations for each entry may be omitted. 3. Show posted T-accounts for all inventories, Cost of Goods Sold, Manufacturing Overhead Control, and Manufacturing Overhead Allocated. 4. How did the SRS Educational Press perform in 2017? Should the company continue to have in-house press production? You will submit your answers/explanations for Final Project I in a memo-style format to the companys leadership team. Use Microsoft Word and Excel. Part 2 Departmental and Master Budgets SRS Educational Supply Company provides educational materials and supplies to educational institutions. The SRS business model is to be a one-stop provider of educational supply needs. For example, some of their product lines include educational workbooks, classroom visual aids, instructor support materials, art supplies, lab supplies, and administrative office supplies. While SRS serves all levels of educational institutions, the majority of their customers are K-12 schools. Sales can vary quite a bit from month-to-month as K-12 educational institutions have seasonal ordering patterns. Thus, budgeting is vital for planning and cash flow purposes. SRS has a June 30, fiscal year end. The companys balance sheet at June 30 is given below: Assets Liabilities & Stockholders Equity Cash $ 40,000 Accounts payable $ 130,000 Accounts receivable 340,000 Inventory 50,000 Capital stock 420,000 Prepaid insurance 18,000 Retained earnings 758,000 Building & equip. (net) 860,000 Total liabilities & Total assets $ 1,308,000 stockholders equity $ 1,308,000 The companys income statement for the year ending June 30 is given below: Sales $ 5,523,000 Cost of goods sold 2,541,000 Gross margin Selling and administrative expenses Shipping $ 249,000 $ 2,982,000 Other 511,000 Salaries and wages 1,104,000 Advertising 685,000 Insurance 27,000 Depreciation 228,000 Total operating expenses 2,804,000 Net operating income $ 178,000 Interest expense 25,000 Net income $ 153,000 The following forecasts have been provided by the organization: Sales forecasts range July $550,000 - $650,000 August $900,000 - $980,000 September $450,000 - $550,000 October $360,000 - $420,000 November $350,000 - $480,000 December $350,000 - $480,000 Purchasing cost range (July December) Cost of goods sold 42% - 50% Operating expense range (July December) Shipping 4% - 5% of sales Other expenses 8% - 9.5% of sales Salaries and wages $85,000 to $95,000 per month Advertising $45,000 - $58,000 per month Insurance $2,000 - $3,000 per month Depreciation $25,000 per month General Instructions for Master Budget Assignment The company has four main departments: Sales, Purchasing, Operations and Finance. Based on the information provided about each department, you will create a master budget for the threemonth period beginning July 1 and ending September 30. You are responsible for creating a budget for each department that will become the master budget. The master budget must include the following detailed budgets: A sales budget by month and in total A schedule of expected cash collections from sales, by month and in total A merchandise purchase budget in dollars. Show the budget by month and in total A schedule of expected cash disbursements for merchandise purchases, by month and in total A selling and administrative budget, by month and in total A schedule of expected cash disbursements for selling and administration, by month and in total A cash budget. Show the budget by month and in total A budgeted income statement for the three-month period ending September 30 A budgeted balance sheet as of September 30 For grading purposes, you will be graded on the accuracy of the budgeted numbers. In addition, you will be graded on the accurate completion of the Budgeted Balance Sheet. Additional Financial Information for the Sales Department SRS has a large number of customers that are K-12 educational institutions. As a result, SRS receives large orders for educational supplies in July and August as schools get ready for the start of the academic year. This is also when educational budgets are still plentiful. Sales begin to decline in September and October and then monthly sales stabilize for the rest of the year (November June) to a range between $350,000 and $480,000. Actual sales for June and your forecasted sales for the next four months are as follows: June (actual) $455,000 July Likely Range: $550,000 - $650,000 (most likely outcome is $600,000) August Likely Range: $900,000 - $980,000 (most likely outcome is $910,000) September Likely Range: $450,000 - $550,000 (most likely outcome is $475,000) October Likely Range: $360,000 - $420,000 (most likely outcome is $385,000) As the accountant, your specific responsibility is to prepare a sales budget and a schedule of expected cash collections from sales by month and in total (July September). Additional Financial Information for the Purchasing Department Most of SRS clients expect a one to three-day turn-around time for orders. It typically takes a week for the company to get merchandise. As a result, the organization states that it has approximately a weeks worth of inventory on hand at all times. For budgeting purposes, the organization should plan to purchase enough merchandise during any one month to meet the sales projections for that month and to end the month with 20% of the next months cost of merchandise sold. The companys cost of merchandise sold ranges from 42% 50% of sales with the most likely outcome for next quarter (July September) of 45% of sales. As the accountant, your responsibility is to prepare a merchandise purchase budget (in dollars) and a schedule of expected cash disbursements for merchandise purchases by month and in total (July September). Additional Financial Information for the Operations Department The Operations and Logistics Department of SRS Educational Supply Company secures advertising that supports the sales efforts, coordinate shipping and delivery of merchandise to clients and provide general administrative support to the other departments. The organization has estimated the companys monthly operating expenses for the next quarter (July September) as follows: Variable: Shipping 4.0% to 5.0% of sales with 5% of sales the most likely outcome Other expenses 8.0% to 9.5% of sales with 8% of sales the most likely outcome Fixed: Salaries and wages $85,000 to $95,000 with $85,000 the most likely outcome Advertising $45,000 to $58,000 with $50,000 the most likely outcome Insurance $2,000 to $3,000 with $3,000 the most likely outcome Depreciation $25,000 As the accountant, you will prepare a selling and administrative budget and a schedule of expected cash disbursements by month and in total (July September). Additional Financial Information for the Finance Department The Accounting and Finance Department of SRS Educational Supply Company manages the accounts receivable and collections, accounts payable, general ledger, and handles the cash management, borrowing and investing activities of the company. Historic collection data (cash collections of sales): All sales are on credit, with no discounts, and due in 15 days. The company has found, however, that only 30% of a months sales are collected by month-end and the remaining 70% is collected in the following month. Historic payment data: Purchases of inventory are paid for as follows: 50% in the month of purchase and the remaining 50% in the following month. Other operating expenses are paid in cash during the month they are incurred. Other planned outlays of cash: During July, purchases of automated equipment totaling $200,000 for cash. New computers for the office will be purchased during August for $90,000 cash. The company plans on declaring and paying dividends of $50,000 during July. Cash management policies: Desired minimum ending cash balance each month: $35,000 The company has a line of credit with a bank. The company can borrow in increments of $1,000 at the beginning of each month. The interest rate on these loans is 1% per month and we assume a simple interest calculation (not compounded). At the end of each month, the company pays the bank as much of the loan as possible (increments of $1,000), while still retaining at least $35,000 in cash. For simplicity, the company pays the bank the interest related to the borrowing for one month at the beginning of the next month. For example, the interest on any borrowing in June is paid in July. As the accountant, you will prepare a cash budget by month and in total (July September) and a Budgeted Income Statement for the quarter ending September 30. * Depreciation on newly acquired assets will be made as an adjustment at the end of the fiscal year.
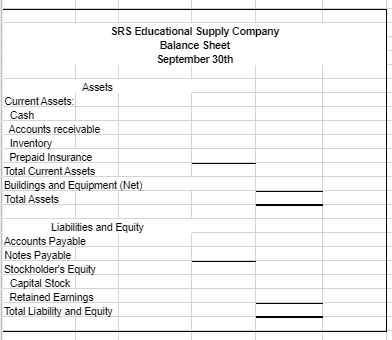
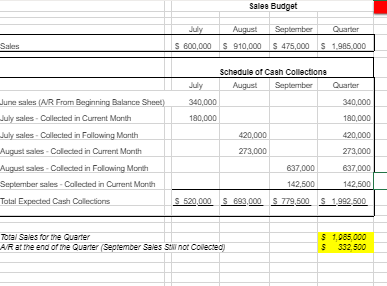
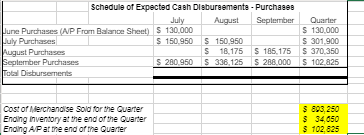
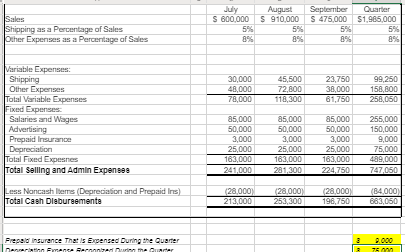
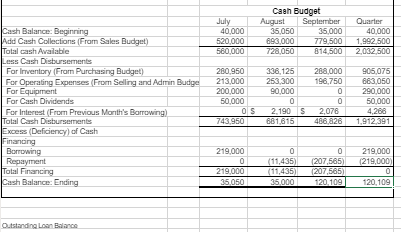
SRS Educational Supplies Company Budgeted Income Statement For the Quarter Fnded September 30th Sales Cost of Goods Sold Gross Margin Selling and Administrative Expenses Shipping Other Salaries and Wages Advertising Prepaid Insurance Depreciation Net Operating Incomes Less Interest Expense Net Income SRS Educational Supply Company Balance Sheet September 30th Assets Current Assets Cash Accounts receivable Inventory Prepaid Insurance Total Current Assets Buildings and Equipment (Net) Total Assets Liabilities and Equity Accounts Payable Notes Payable Stockholder's Equity Capital Stock Retained Earnings Total Liability and Equity Sales Budget July S 600,000 August S 910,000 September S 475,000 Q uarter S 1.985.000 Schedule of Cash Collectione August September July Quarter 340,000 180,000 June sales (NR From Beginning Balance Sheet) July sales - Collected in Current Month July sales - Collected in Following Month August sales Collected in Current Month August sales Collected in Following Month September sales - Colected in Current Month Total Expected Cash Collections 420,000 273,000 637,000 142,500 S 893.000 S 779,500 340,000 100,000 420,000 273,000 637,000 142,500 $1.992,500 S 520.000 Tora Sales for the Quarter AR at the end of the Quarter September Sales Sant Collected 5 $ 1 285 000 392 500 Schedule of Expected Cash Disbursemente - Purchases July August September Pune Purchases (AP From Balance Sheet) $ 130,000 July Purchases $ 150 950 150 950 August Purchases S 18175 S 185.175 iepinber Purchase $ 280,950 $ 336 125 S 286.000 Total Disbursements Quarter $ 130.000 S 301.900 S 370.350 S 102.925 Cost of Merchandise Sold for the Quarter Ending inventory at the end of the Quarter Ending A Parme end of the Quarter $ 893.250 $ 34.650 402825 S 600.000 August S 910.000 September $475 000 Quarter $1.985.000 Shipping as a Percentage of Sales Other Expenses as a Percentage of Sa 30.000 48,000 78.000 45.500 72 800 110,300 23.750 38.000 61,750 99,250 158,800 258,050 Variable Cxpenses Shipping Other Expenses Total Variable Expenses Fixed Expenses Salaries and Wages Advertising Prepaid insurance Depreciation Total Fixed Expesnes Total Selling and Admin Expenses 85.000 50.000 3.000 25,000 1837000 241.000 85.000 50.000 3.000 25,000 5.000 255.000 1 50,000 150,000 3.000 9,000 25,000 75,000 83.000 489.000 224.750747050 160.000 281,300 Nancash (Depreciation and Prepaid Ins) Total Cash Disbursementa (28.000 213.000 2000 253,300 128.000 196,750 MOCO 663,050 Pred urance that is expensed During the Quarter 40.000 520.000 Cash Budget August September 35.050 35.000 693.000 779.500 728.050 814 500 Quarter 40.000 1.9907500 2032 500 338.125 253 300 90.000 288.000 196.750 Cash Balance: Beginning Add Cash Collections (From Sales Budget) Total cash Available Cash Disbursements For Inventory (From Purchasing Budget) Por Operating Expenses (From Selling and Admin Budge For Equipment For Cash Dividends For Interest (From Previous Month's Borrowing) Total Cash Disbursements EXCO (Deficiency of Cash Financing Borrowing Repayment Total Financing Cash Balance: Ending 280.950 213.000 200.000 50.000 OS 743 950 905.075 6637050 200 000 000 2.190 5 6 81.615 0 2.076 486.826 4200 1.912391 219.000 219.000 219.000 0 207,565) 2 07 5651 120 109 (11,435) 11.435 35.000 219.000 35.050 120.109 Otstanding Lan ge SRS Educational Supplies Company Budgeted Income Statement For the Quarter Fnded September 30th Sales Cost of Goods Sold Gross Margin Selling and Administrative Expenses Shipping Other Salaries and Wages Advertising Prepaid Insurance Depreciation Net Operating Incomes Less Interest Expense Net Income SRS Educational Supply Company Balance Sheet September 30th Assets Current Assets Cash Accounts receivable Inventory Prepaid Insurance Total Current Assets Buildings and Equipment (Net) Total Assets Liabilities and Equity Accounts Payable Notes Payable Stockholder's Equity Capital Stock Retained Earnings Total Liability and Equity Sales Budget July S 600,000 August S 910,000 September S 475,000 Q uarter S 1.985.000 Schedule of Cash Collectione August September July Quarter 340,000 180,000 June sales (NR From Beginning Balance Sheet) July sales - Collected in Current Month July sales - Collected in Following Month August sales Collected in Current Month August sales Collected in Following Month September sales - Colected in Current Month Total Expected Cash Collections 420,000 273,000 637,000 142,500 S 893.000 S 779,500 340,000 100,000 420,000 273,000 637,000 142,500 $1.992,500 S 520.000 Tora Sales for the Quarter AR at the end of the Quarter September Sales Sant Collected 5 $ 1 285 000 392 500 Schedule of Expected Cash Disbursemente - Purchases July August September Pune Purchases (AP From Balance Sheet) $ 130,000 July Purchases $ 150 950 150 950 August Purchases S 18175 S 185.175 iepinber Purchase $ 280,950 $ 336 125 S 286.000 Total Disbursements Quarter $ 130.000 S 301.900 S 370.350 S 102.925 Cost of Merchandise Sold for the Quarter Ending inventory at the end of the Quarter Ending A Parme end of the Quarter $ 893.250 $ 34.650 402825 S 600.000 August S 910.000 September $475 000 Quarter $1.985.000 Shipping as a Percentage of Sales Other Expenses as a Percentage of Sa 30.000 48,000 78.000 45.500 72 800 110,300 23.750 38.000 61,750 99,250 158,800 258,050 Variable Cxpenses Shipping Other Expenses Total Variable Expenses Fixed Expenses Salaries and Wages Advertising Prepaid insurance Depreciation Total Fixed Expesnes Total Selling and Admin Expenses 85.000 50.000 3.000 25,000 1837000 241.000 85.000 50.000 3.000 25,000 5.000 255.000 1 50,000 150,000 3.000 9,000 25,000 75,000 83.000 489.000 224.750747050 160.000 281,300 Nancash (Depreciation and Prepaid Ins) Total Cash Disbursementa (28.000 213.000 2000 253,300 128.000 196,750 MOCO 663,050 Pred urance that is expensed During the Quarter 40.000 520.000 Cash Budget August September 35.050 35.000 693.000 779.500 728.050 814 500 Quarter 40.000 1.9907500 2032 500 338.125 253 300 90.000 288.000 196.750 Cash Balance: Beginning Add Cash Collections (From Sales Budget) Total cash Available Cash Disbursements For Inventory (From Purchasing Budget) Por Operating Expenses (From Selling and Admin Budge For Equipment For Cash Dividends For Interest (From Previous Month's Borrowing) Total Cash Disbursements EXCO (Deficiency of Cash Financing Borrowing Repayment Total Financing Cash Balance: Ending 280.950 213.000 200.000 50.000 OS 743 950 905.075 6637050 200 000 000 2.190 5 6 81.615 0 2.076 486.826 4200 1.912391 219.000 219.000 219.000 0 207,565) 2 07 5651 120 109 (11,435) 11.435 35.000 219.000 35.050 120.109 Otstanding Lan geStep by Step Solution
There are 3 Steps involved in it
Step: 1

Get Instant Access to Expert-Tailored Solutions
See step-by-step solutions with expert insights and AI powered tools for academic success
Step: 2

Step: 3
Ace Your Homework with AI
Get the answers you need in no time with our AI-driven, step-by-step assistance
Get Started
Auditor Essentials 100 Concepts Tips Tools And Techniques For Success
Authors: Hernan Murdock
1st Edition
1138036919, 978-1138036918